
Something In their Papillae
Video: The Story With Less Detail
The papilla is where urine leaves the kidney. It is where plaque forms, and plugs. Most calcium stones form there.
Though just a few millimeters long, those few millimeters extract water and supersaturate the urine – the supersaturations create stones.
Take a look at how the kidney is put together, if you do not remember.
Stone Former Papillae Absorb More CT Radiation than Normal
On CT, the papillae of stone formers are darker gray than normal – more dense. You cannot see it, too subtle. But the routine tools on every CT reader let you measure density – how much radiation is blocked. The density is in Hounsfield units, HU, higher means more radiation is blocked.
The difference between normal and stone formers is relatively small, 30 HU vs. 45 HU, but highly significant statistically. By contrast, a calcium stone can be over 1,000 HU. But it is not the stones, it is the kidney tissue itself that is abnormally dense in people who form stones.
Living cells and tissues regulate themselves closely, so a higher tissue density means something abnormal in the way this part of the kidney functions.
SPOILER: High Fluid Intake Can Bring Papillary Density Down to Normal
I shall show you high fluid intake lowers the density back to normal. So however kidneys create the abnormal papillary density, increased fluid intake somehow reverses that process.
Why Did People Pursue This Problem?
Calcium crystal plaque and plugs form in the papillae and stones grow on them. Calcium is a heavy atom that absorbs radiation, so high density could gauge the deposits and therefore predict new stones, or recurrence.
Nifty.
Drinking more dilutes the urine and all the fluids inside the kidney, so maybe plaque and deposits might dissolve. If so, density might fall after a spell of high fluid intake.
Good ideas, and they panned out. Something patients and physicians should know about.
Where I Got My Facts From
Using the PubMed search “CT papillary density kidney stones” yielded 105 articles. Here is the collection for you scholars who might want more.
A huge proportion concern prediction of stone composition from stone CT density, something patients should know about and physicians do. I will not review that topic here – some other time, perhaps.
Of the total, nine focused on CT papillary tissue density – here they are.
First Evidence for Higher Density
Dr. Brian Eisner first reported this abnormality, and deserves first place in our story.
What His Group Did, and Why
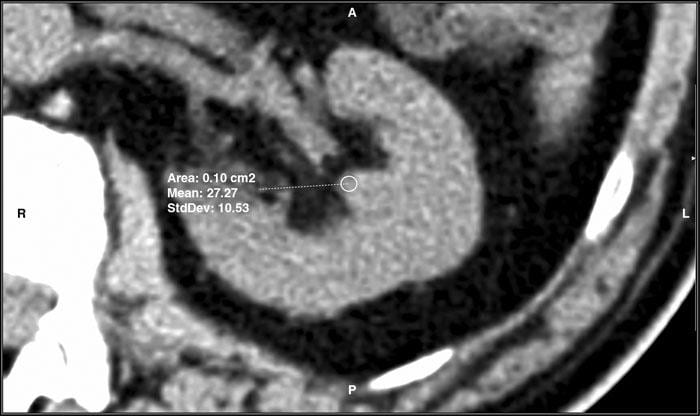
His group measured CT density (Hounsfield units, HU) like in this article’s featured picture. Using the toolbox every physician has when viewing a CT, they magnified the kidney view five fold, selected a region of interest (ROI) at the papillary tip (of 0.2 cm2 in this case) and measured the density.
They compared 17 patients each with a single stone in one kidney to 15 age matched controls – normal people who had CT scans as part of evaluation for donating a kidney. They also measured density in the opposite non stone forming kidney of the stone formers, the one with no stone in it.
What They Found
They made four comparisons of mean papillary density.
First Comparison
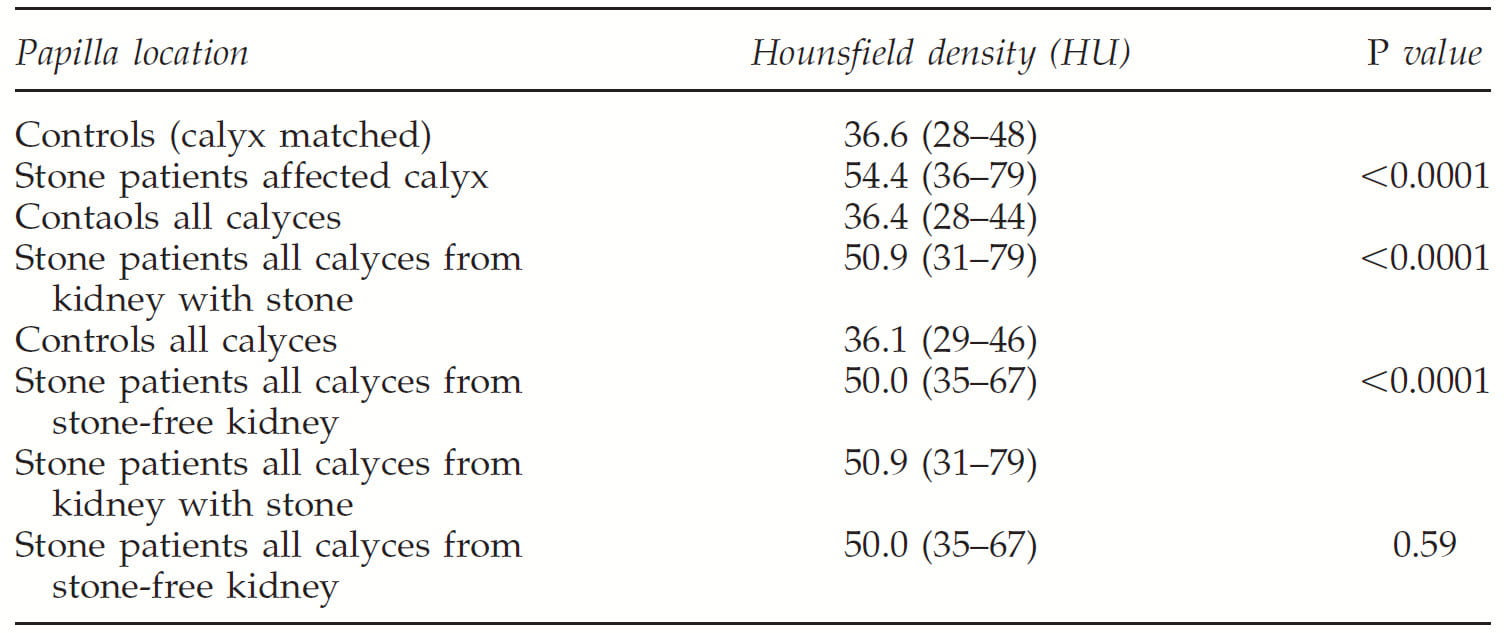
The first was between papillae in a calyx that contained a stone (the measurement excludes the stone!) vs control papillae. As is obvious they differed a lot (54 vs 36, p<0.0001).
Second Comparison
The second was between papillae in all calyces in stone formers vs. controls. They also differed remarkably (36 vs. 51, second comparison on the table, p<0.0001.
Third Comparison
The third was controls vs the stone free kidney of stone patients, all calyces. Even though that kidney had never formed a stone, the papillae were abnormally dense 36 vs. 50, p<0.001.
Fourth Comparison
The fourth was between the stone forming and non stone forming kidneys of the 17 stone formers (51 vs 50, p, NS). Whether or not the kidney had made a stone did not matter. It was being a stone former that somehow caused higher papillary density.
Can Papillary Density Predict Stone Onset
Dr. Alexandru Ciudin and colleagues performed four studies concerning whether a high papillary density precedes kidney stone onset or recurrence, meaning it might be able to predict.
The Hypothesis
Given that papillary density is high in stone formers, it may be so because of deposits of plaque or crystal plugging. If plaque and plugs cause stone disease, and therefore precede stones, and if plaque and plugs cause higher CT density, then dense papillae should predict someone will become a stone former before they have formed a stone.
The First Study
The Experiment
Out of 413 patients with kidney stones, they found 31 patients who had had a first CT scan unrelated to stones, had not passed stones, and had no stones on that first CT, but then went on to produce calcium oxalate or calcium phosphate stones. Their second CT scan was because of their stones.
They compared the patient CT scans to scans from 31 people who were potential kidney donors and had no history of stones nor any stones identified by the CT used to confirm their eligibility to donate.
 The Measurement
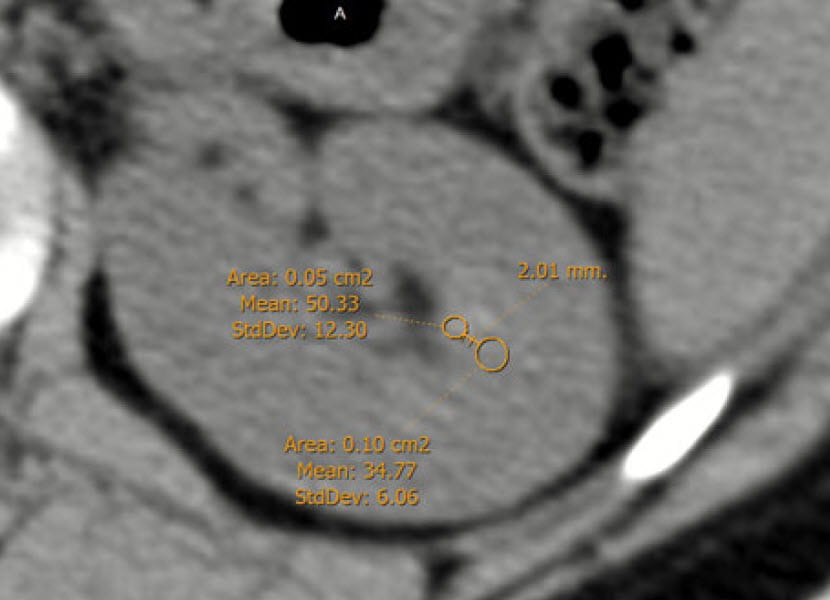
They measured CT density (Hounsfield units, HU) according to the picture at the left. They magnified the kidney view five fold and selected a region of interest (ROI) at the papillary tip, as Eisner did, but smaller (0.05 cm2) and added another, larger ROI of 0.1 cm2 2 millimeters in toward the kidney (the medulla). They measured the HU at each ROI.
They did this for a papilla from each of the main calyces of the kidney (lower, middle, and top), and took the precaution that those who measured did not know who the person was – blinded observer.
Higher Density Precedes Stones
They had three groups: 31 stone formers (SG), 31 controls (CG), and the 31 stone formers before stones were known about (SGPS). They had measurements for SG and SGPS for the kidney that made a stone (stone side) and the kidney that did not (Stone free side). They also pooled results for SG, SGPS to compare to CG (Table below).
In all three groups the medullary area density was about 30-32 HU.
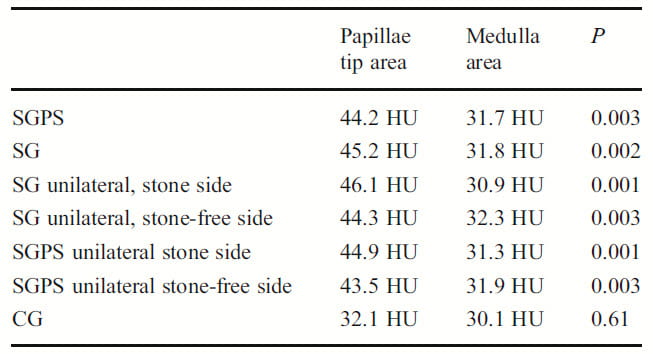 The papillary tips of controls (CG at the bottom of the table) was 32 HU – same as the medulla and similar in magnitude to what Eisner found.
In the stone formers, before (SGPS) and after they had stones (SG) papillary density was 44 – 45, statistically higher than in the medulla. That held for both the stone side and stone free side kidneys.
In a direct comparison (not shown in the table), the mean papillary density of SGPS and SG for both kidneys was 44 – 45 vs. 32 for CG, p<0.001. The medullary densities did not differ between CG and either stone forming measurements.
The Second Study
The Experiment
This group went on to validate their findings in a larger group of patients (134), and with selection for only patients with a known calcium stone composition – calcium oxalate, calcium phosphate (including brushite). They compared them to 134 potential kidney donors who did not have stones on the CT that validated their donor status.
The measurement
They measured papillary density in a 0.1 cm2 ROI in in the papillae from the upper, middle, and lower pole calyces in the stone formers (SFG) and controls (CG). Earlier CT scans reconstructed kidneys in 5 mm thick sections, which they used for this work. But more modern scan reconstruction uses thinner sections, so they made a comparison, in some cases, between 5 and 1 mm reconstructions. Briefly, there was no difference – a technical but not trivial point.
The Results
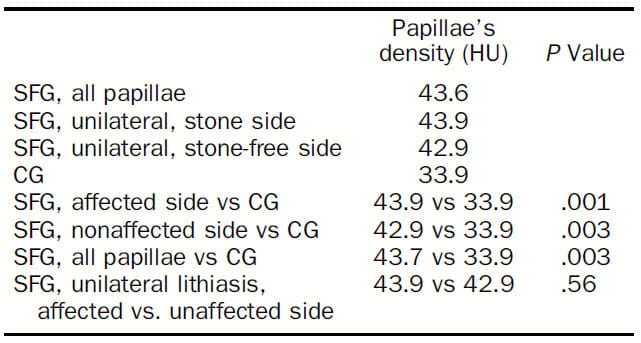
The obvious point is that in this larger and more selected population papillary density of the SFG (first three rows in the table) is above the control, CG, group.
Furthermore, the stone affected and stone unaffected sides are more dense than controls – you can read the comparisons in the table to the left. Kidneys with stones (affected side), without stones but in stone formers (‘nonaffected’ side), and both kidneys combined (all papillae) were denser than the controls (CG).
The two kidneys of stone formers, the one with and without a stone are not different (bottom line of table, 43.9 vs.42.9, p. NS)).
What Does This Add?
It adds heft to the fact that papillary density is abnormally high in stone formers. Likewise, it adds focus to the idea they work under, that plaque is a base for calcium stones, not cystine or uric acid stones, and abnormally high papillary density arises from that plaque.
The Third Study
The same investigators asked the question about predicting new stone onset using a much larger group of people in whom new onset could be very well defined.
They identified 1000 people who had a CT performed between January and March 2005. From the 1000 they selected 576 who were not known to have kidney stones. Of these 177 were lost to followup leaving 362 study patients whose CT had been performed 7 years before. Of these, 11 became calcium stone formers during the 7 years since the CT scan. In all but one stone disease was documented by CT, in one case by ultrasound.
They Measured Radiological Papillary Density
They measured HU density in a 0.1 cm2 papillary ROI in the lower, middle, and upper kidney regions, 5x magnified image. They did not include a medullary control. In seven cases stones were confirmed as calcium based by analysis. In the other 3 the CT density was above 600 HU and therefore classed as calcium based as opposed to uric acid.
Higher Density Predicted Stones
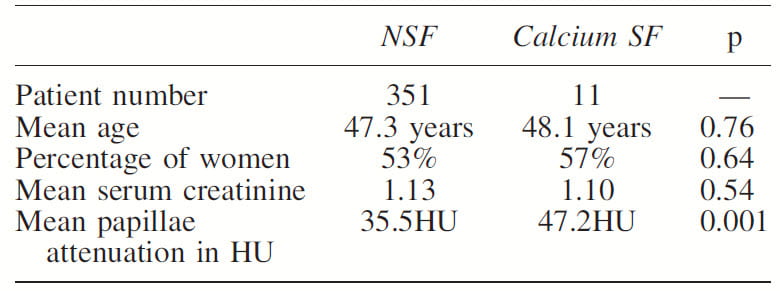 Mean density of those who became stone formers was 47.2 vs. 35.5 HU, p<0.001 for those without new stone onset (Table to the left). In a sub analysis use of 1 mm slices (closer to modern technique) did not alter results vs. the 5 mm slices used in this study.
Of note, the sex ratio, age, and serum creatinine levels did not differ between the two groups.
The cut point of 43 HU best discriminated the two groups using ROC curve analysis: this cutpoint gave 82% sensitivity and 97.7% specificity). However the number of people who because stone formers was very small, so this is still preliminary at best.
The Fourth Study
In an attempt to explore all possible uses for papillary density, this same investigators gathered two groups of stone formers. The first had a stone and was stone free by CT after that event and remained so. The second was stone free after an event and went on to a proven recurrent new stone.
An original group of 543 patients had a first episode of stones: of these 266 were 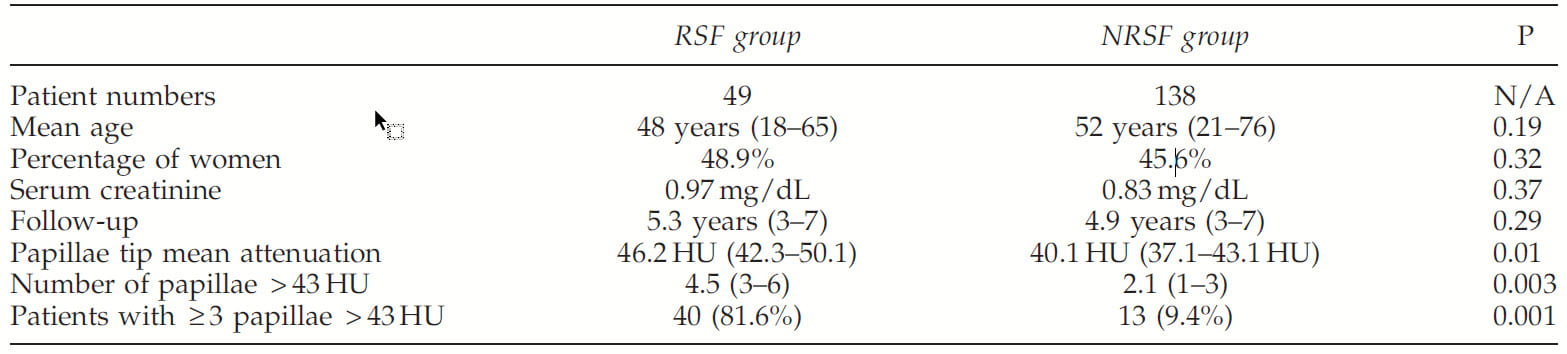 already recurrent stone formers. Of these, 43 formed non calcium based stones. From the remaining, 36 never had a CT and 11 did not have confirmed stone free status. This left 187 first calcium stone formers proven stone free after the first stone attack. During a mean of 5.1 years of followup, 49 of the 187 had at least one more stone vs. 138 who remained stone free.
The mean papillary density was higher in those who recurred (RSF in the table) but the p value was only 0.01. More convincingly, those who recurred had more papillary with high density – above 43 HU (bottom 2 rows in the table). All the rest, age, sex, and serum creatinine were not different.
This study is not without importance. In a way it does suggest that density has a lot to do with stone formation – why else would higher density associate with recurrent stones?
Density is High in All Stone Formers
Given that plaque and plugging are common in stone formers of all kinds, one might think that density would he abnormally high in all stone formers except those with struvite stones from infection. Even in those, many begin with routine stone disease and may have higher papillary density.
The Eisner group went on to do what remains the most comprehensive study of the matter.
What Was Done
To test this idea, they used patients who had CT scans showing a single stone of known composition in 1 kidney, and no other stones in that kidney or in the opposite side kidney.
This gave them papillary density in each patient from a papillum from a calyx with a stone in it (A), calyces without stones from the stone bearing kidney (B), and calyces in the opposite side stone free kidney (C). They also had density measurements from non stone forming potential kidney donors. Density was measured in a 0.2 cm2 ROI in the region of the papillae, 5x magnified image.
 What Was Found
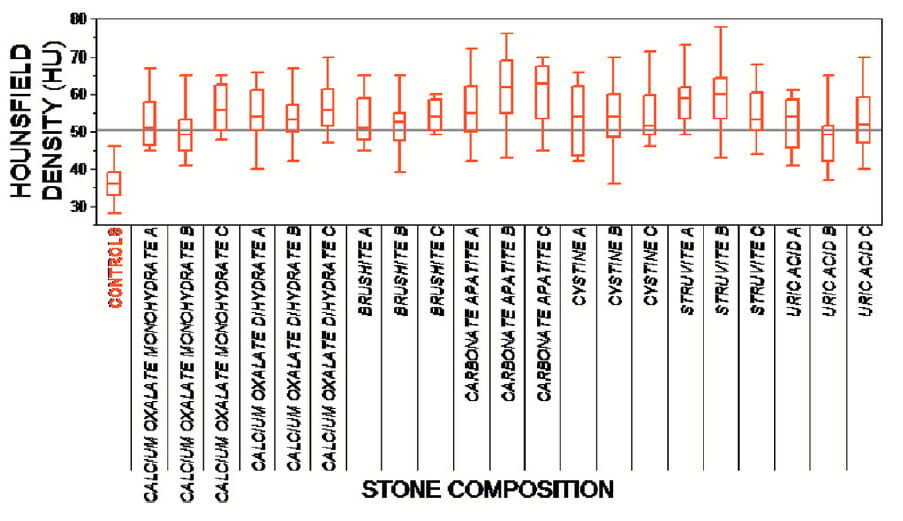
Numbers were small (6-15 cases/group) as they had 8 groups (Figure to the left), but sufficient for their main message.
The horizontal line is at 50 HU. Control mean was 32.2 with a standard deviation of 4, so the line is 4 SD above the control mean. One expects 99.7% of control values will be below that line.
Compared to the controls (far left box) density was high in all stone formers. Not only that, it was as high in the opposite side (C) as in the stone bearing side, and in the calyces with (A) and without (B) a stone.
Of interest, even cystine, struvite, and uric acid stone formers had abnormally high papillary density, although their stones do not necessarily contain calcium crystals that would block radiation and raise density measurements that are, after all, reflecting how much radiation is blocked by a papillum.
One Study Partly Disagrees
Dr. Ersan Arda and colleagues compared papillary density between normal controls, and single or recurrent stone formers. Unlike the other studies they present median values and find a difference only between normals and those with recurrent stones (26 vs 29 HU median values, significant statistically). The work was performed in Turkey.
These values are much below what others have reported, and this might partly be because they report medians whereas others report means.
They note that the data for HU values in not normally distributed, and this obvious from the position of the medians within the ranges – single stone formers median 26.5 range 12 – 56, recurrent stone formers 29 range 12 – 60.
Mean values will be raised vs. medians if there is a high tail, as is suggested by the above comparisons.
Even so, in the Eisner graph (Above), patient data lie 4 standard deviations above the normal controls, so it is not easy to reconcile this work with what has been done by others.
Water Can Lower Papillary Density
Dr Pietro Ferraro asked if fluids might obliterate the high density of stone former papillary tips. If so, perhaps fluid can reduce plaque and plugging.
Before Increased Fluid Intake
All of these patients formed calcium oxalate stones and had a CT before their stone removal surgery – seemingly ureteroscopy. Papillary density was measured in at least 6 papillae of right and left kidneys – 2 from the upper, middle, and lower pole calyces – for a total of 12 in all per person. They measured density using a 0.1 cm2 ROI.
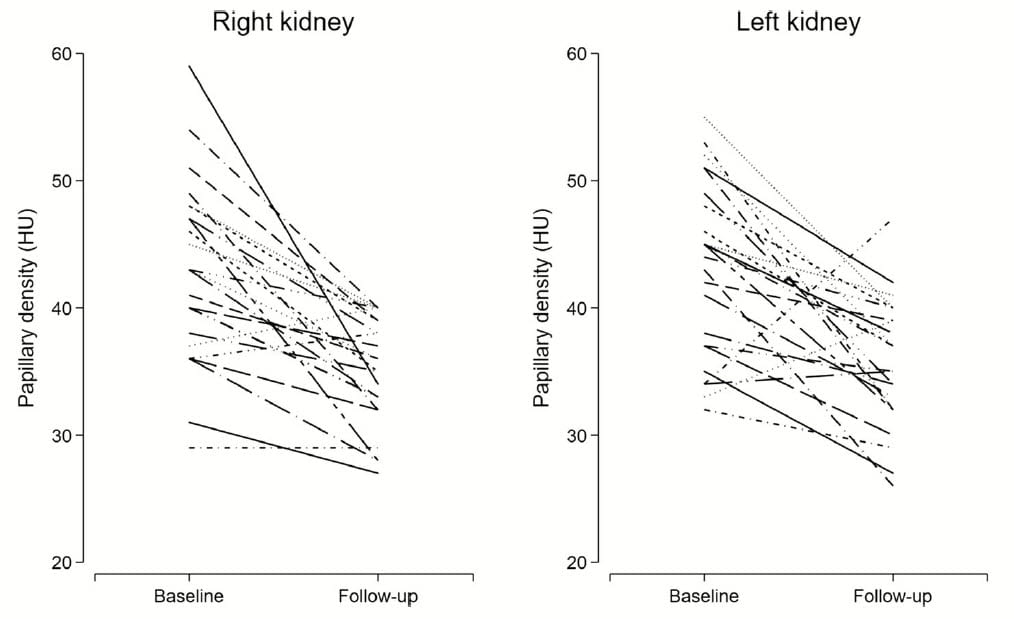
Here, each person is line. Baseline means were 43 HU for both left and right kidneys.
This is consistent with values found in all studies except that from Arda and colleagues.
The raw data themselves, by patient, cast doubt on my idea that medians from the Arda group are the main reason their values are so low.
Almost no baseline values are below 30 in either group, and if the median is at the center of the range it would be close to 40, not 26.
After Increased Fluid Intake
These 25 patients were told to drink at least 2 liters/day of dilute fluids – water mostly – for a year. Nurses called to encourage them, but there were no interim 24 hour urine samples to assure adherence to high fluid intake.
New CT scans were done after the year. In almost all cases papillary density fell. Mean values were 35 HU, the mean change was -7.8 HU and the 95% confidence for the change was -10.6 to -5.1 HU, p<0.001. Note that the approximate midpoint of high fluid values, the median, lies around 35, near the mean, and far above the Arda study. The follow up value of 35 HU is around that of normal papilla in all studies but that of Arda and colleagues.
Stone Formers Have High Papillary Density
Multiple Labs, Multiple Patient Groups
Even though one lab dissents, the weight of evidence lies on the side of an association between stone formation and abnormally high papillary CT density. Heft arises especially arises from the numbers of patients, the different populations of patients and controls, and different research groups all doing more or less the same thing.
Excellent Example of Empirical Research
Repeated experiments that return similar results are hallmark of a convincing empirical research. The goal was to determine if stone formers have abnormally high papillary density as a trait, and the answer seems ‘yes’.
Empiricism advertises itself as unbiased and hypothesis free, but cannot be without hypotheses. Who would go the effort of assembling these patients and making so many measurements if not guided by an idea?
What About the Arda Data?
I assume the Arda lab did their work correctly. Median vs. mean value analysis does not seem to account for their differences from all other studies.
Perhaps their patient groups differ from the others. Perhaps some other aspect of how things were done. I think an exchange of CT files would be important to reconcile this group with the others.
Why Fluids Lower Papillary Density?
May Not Reflect Dissolution of Plaque or Plugs
It seems to me possible but not most likely that the year of fluids (24 hour urine volume at one year was 2000 ml) washed out plaque and plugs. Plugs are hydroxyapatite crystal deposits in injured tubules. Plaque is hydroxyapatite crystals in the papillary interstitial tissue. If asked to bet on the outcome, I would not favor this idea.
Possible Accumulation of Calcium or Sodium or both
Perhaps the most obvious and reliable difference between calcium stone formers and normals is hypercalciuria. There is more calcium at the papillary tips, for the fluid there is about to become the final urine. There also may be more calcium in the tissues between the tubules, the interstitium, for that is where plaque forms.
We have proposed abnormal wash down of calcium into that space as a possible cause of plaque. Maybe that extra calcium is enough to raise tissue density.
Any of these causes could be offset by constant high fluids, because they tend to reduce accumulation of materials deep in the kidney medulla and papillum.
Two Experiments to Discriminate Between The Two Mechanisms
Brief High Fluids
High fluids for a few weeks. Long enough to wash out calcium and other salts, very unlikely to dissolve fixed tissue calcium deposits. I predict it will abolish the high density.
Repeat Surgical Observations
More and more stone patients have these, and many will have decent evidence of a year or more of high fluids. Surgeons can begin to assemble case series and tell us if density has fallen and if that fall is accompanied by loss of plugs or plaque. If well done, each report is an experiment, in the sense that fluids were prescribed as a treatment. The comparison is plaque and plugging vs. HU density between the first and second surgery.
CT Density As a Guide to Fluid Management
Why not measure papillary density in every stone former who needs a CT?
No extra radiation, a few minutes at the workstation. With time, especially in those with recurrent stones, CT scans will be repeated, and one can use change or not in density to judge fluid treatment.
I, for one, plan to do it, write the density results into my patient note and share results with the patient.
No doubt baseline will be 40 – 50, on average. But patients who produce at least 2 liters/day for a year will presumably show a fall of about 10 HU. No fall, perhaps fluids are not enough.
Brian, I just read your 2008 paper and should have included it in my post. Thank you for bringing it here. You did indeed publish the main finding years before the present publication. I find reassuring that the average HU of stone forming and control patient papillae correspond between the two papers, meaning that the measurement is robust. That papillae of uric acid stone formers also have more density is of real interest in that such patients can plug their Bellini ducts; we have not as yet published the pathology of those papillae and I cannot tell you the nature of the crystals. Fred