![Pieter Brueghel the Elder [Public domain], via Wikimedia Commons](https://kidneystones.uchicago.edu/files/2018/03/Pieter_Bruegel_the_Elder_-_The_Tower_of_Babel_Vienna_-_Google_Art_Project_-_edited.jpg)

Obesity Is Epidemic World Wide
Anyone can find ample evidence of US obesity. Here is a recent CDC map.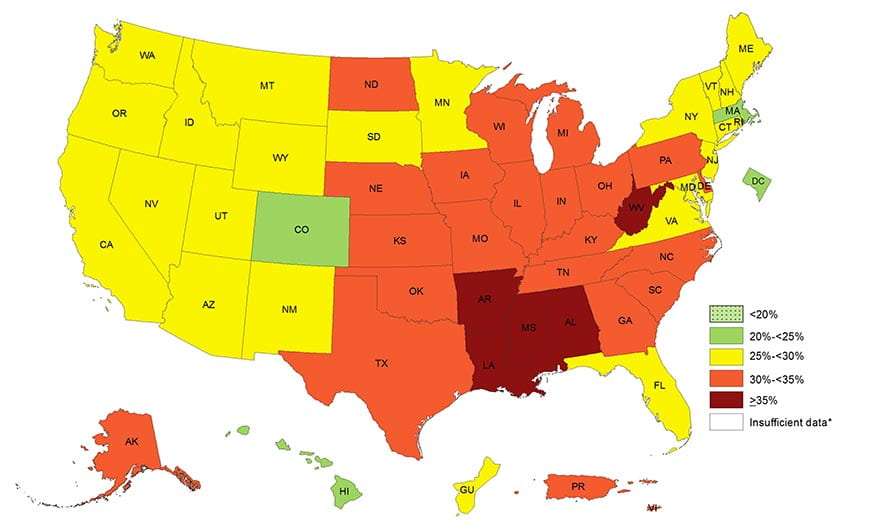
In response, ‘bariatric’ surgeries designed to reduce body fat stores by limiting and re-routing nutrient absorption have risen to very high levels. The American Society for Metabolic and Bariatric Surgery estimates rates at 158,000 procedures in 2011 and 216,000 in 2016.
Europe, and the rest of the world share the obesity problem.
This is one of an almost endless number of graphs and maps I can put forward to document what is in fact a remarkable event in human history. Naturally, bariatric surgery rates have risen world wide, as they have in the US.
The magnificent Tower of Babel Pieter Brueghel the Elder (1526/1530–1569) hangs in the Kunsthistorisches Museum, Vienna, Austria.
Bariatric Surgeries Cause Kidney Stones
Not all, not all the time, but often enough to matter to us. Thus this article.
My First Meta-analysis
I Do Not Love Them
This breed of scholars does no science, if science is to find what nature does, or how to do what we desire. Instead they curate and compile what others labor to discover and because of that indirect connection to the science results often are slightly off, as when we read poetry translated from another language.
For This Article I Have Chosen to Use One
Even so, the authors of this meta-analysis copied down from recent publications some of what we need here, and so I use their work as they the science of those who did it. In particular, this recent analysis summarized information about two issues: Do the bariatric surgeries increase kidney stone formation, and do they alter urine stone risk factors in a direction that would foster stones?
What Have The Scholars Done?
They chose from 441 articles the 14 (12 articles in their introduction but 14 in their tables) they judged as sound concerning effects of surgery on stones, and on the causes of stones. All 14 are observational. Seven compare patients who had surgery to others (controls) who did not (Patients – Controls, P-C). Seven compare patients after surgery to themselves before surgery (After – Before, A-B).
They could count numbers of stones in only 3 of the studies, all P-C in design.
As much as possible, they harvested urine risk factor data. Using complex statistics I am sure they well understand, they converted P-C and A-B into mean changes, their standard errors, and upper and lower 95% confidence limits.
What Have I Done?
From their means and estimates of variability I made my own pretty graphs. Their ‘Forest plots’ display so wide a range of values on one scale differences we care about become invisible.
I found drawings of the bariatric surgeries, so we can understand their various re-routings of food.
I wrote as clearly as I could.
The Bariatric Surgeries
The picture just below is from a nifty article that includes a brief review of how the surgeries actually produce weight loss. I clipped off its top – that showed only normal anatomy – to make more room for the surgeries.
Restrictive Procedures
Gastric banding (GB)
Surgeons wrap an inflatable silicon tube around the top of the stomach where the esophagus comes into it. Inflation can be adjusted by putting more or less saline in through an external port. As one eats, this tiny remnant fills far more rapidly than the capacious stomach, so eating tends to stop.
Vertical Banded Gastrectomy (VBG)
A band closes off the upper part of the stomach pouch so food can go only along the lesser – inner curvature. A second lower band narrows that channel which then drains into the duodenum. Secretions from the upper stomach drain through the main pouch to meet the food forced through the narrow small one so they drain together into the duodenum.
Sleeve Gastrectomy (SG)
Most of the pouch is removed leaving only a narrow channel for food. It is like the vertical banded gastrectomy in a way, but the stomach is greatly reduced in size. This means that less gastric secretion are produced and delivered into the duodenum.
Malabsorptive Procedures
Jejuno-ileal Bypass (JIB)
The duodenum, where bile and pancreatic fluids enter the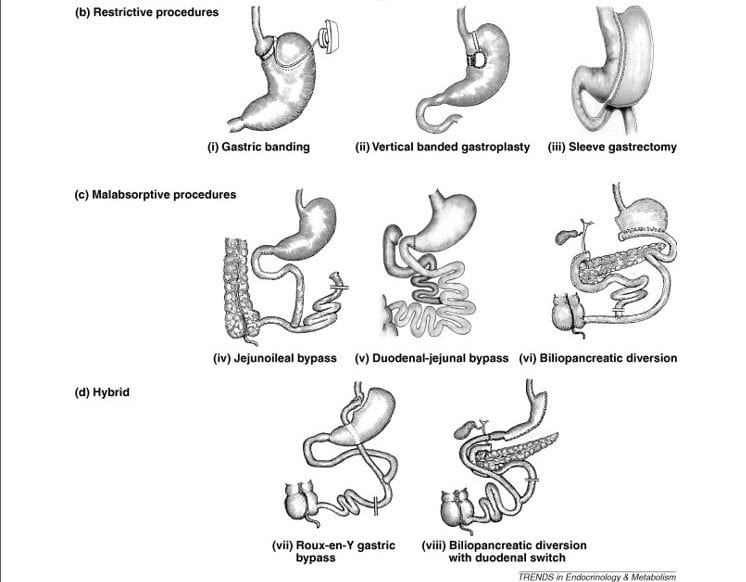 bowel, are connected through a very short length of jejunum straight into the end of the ileum. Because this leaves very little intestine to absorb nutrients, the procedure causes malabsorption.
When I was young I more than once saw patients with this procedure. A few still come to me. Surgeons almost never do it now. But it illustrates in a blunt way what this whole class of surgeries is about. One way or another they limit the bowel surface for absorption of food nutrients. In all cases, they must preserve drainage of bile and pancreatic fluids into the food stream. The result presents to the colon a larger share of nutrient than normal.
Duodenal – jejunal Bypass (DJB)
Though not yet in clinical practice, it is instructive to study. Ileum, not duodenum, drains the stomach. The duodenum is left connected to the jejunum which drains into the ileum lower down, so bile and pancreatic fluids get into the food stream from which the entire duodenum and jejunum are excluded.
Bileopancreatic Diversion (BPD)
As in the other two procedures, food is excluded from the duodenum and jejunum. The duodenum is disconnected from the stomach. Part of the stomach is resected and ileum is sewn along the bottom curve to drain it into the cecum and thence the colon. Bile and pancreatic fluids (the pancreas is drawn in here; the two upward facing twigs represent the bile ducts from the liver) enter the nutrient stream just before it drains into the cecum.
Hybrid Procedures
The idea here is synergy: Restrict gastric volume so as to limit intake, and reduce absorption surface, but both in less extreme measure to achieve the benefit of weight loss with less symptoms of fullness and less risk of serious malnutrition.
Roux – en -Y Gastric Bypass (RYGB)
In this most common surgery the esophagus empties into a tiny remnant of stomach (small pouch) that drains into a segment of jejunum (the “Roux limb’). Secretions from the large intact remnant stomach pouch drain into the duodenum, mix with pancreatic secretions and bile, and this mixture drains into the ‘Roux limb’ at the so called entero-entero anastomosis. The ‘Y’ stem is the common nutrient channel below where the two streams meet, the upper twigs are the Roux limb and duodenal – pancreatic – bile drainage limb. The degree of malabsorption is driven by the length of the jejunum that is excluded from food.
Biliopancreatic Diversion With Duodenal Switch (BPD-DS)
Here, about 70% of the stomach is removed creating a sleeve, and that reduced stomach drains into a shorter ‘digestive loop’ of bowel, that can include jejunum and ileum. The duodenum, and bile and pancreatic fluids drain through the longer (biliopancreatic) loop of jejunum into the digestive loop to form the common channel. This is like RYGB in having both restriction and malabsorption and a ‘Y’ configuration. But here the duodenum is switched from the stomach to become blind ended at its top. The result is more malabsorption than in RYGB.
How Bariatric Surgeries Cause Weight Loss
Because they have a medieval – even grotesque – appearance, one might presume these surgeries simply deprive people of their intestines as food absorptive organs, so they lose weight from starvation. But that is wrong. For example, in RYGB as usually performed, malabsorption per se is very modest.
Modern science has uncovered a more subtle and humane mechanism for these procedures to reduce fat stores and improve health – less diabetes as an example. All of them increase delivery of nutrients to the ‘hind gut’, the distal third of the transverse colon to and including the rectum. These segments of colon and rectum produce hormones that affect appetite and insulin regulation.
I do not want to discuss this now, here, but perhaps might in a less practical article, sometime later.
Do Bariatric Surgeries Cause Kidney Stones?
They can.
Type Matters
Of the 14 studies, only three allowed stone counting. One concerned RYGB, SG, and BPD-DS, the other two RYGB and GB, one each. All were surgery vs. control group (P-C).
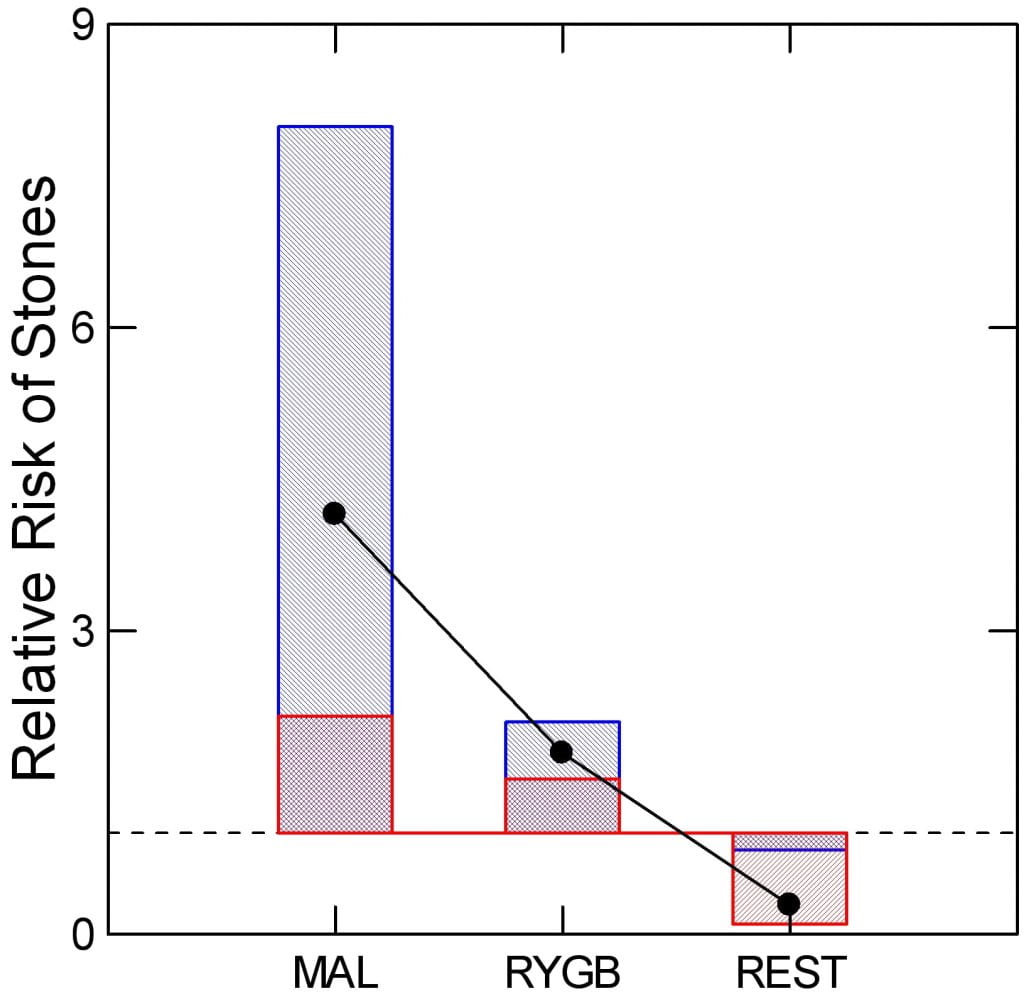
How My Graph Works
I have plotted the mean relative risk ratio (RR) of surgery vs. control for the malabsorptive (MAL) procedures (BPD -DS), RYGB, and restrictive (REST) patients (SG, GB). Dots show the mean relative risk ratio. Blue bars show the upper and lower 95% confidence intervals of the ratio. The red crosshatching marks the bottom or top of the blue bar. The dashed line marks an RR of 1 .
Differences by Procedure
Malabsorptive and RYGB procedures raise RR above 1, enough that the lower 95th percentiles of their respective blue bars fail to cross the line at 1. By contrast, the restrictive procedures appear to lower stone risk; the upper 95th percentile of the RR does not cross the line at 1. So one cannot say bariatric surgery raises kidney stone risk. Instead RYGB and BPD-DS raise it, and perhaps restrictive procedures lower risk.
How Do Bariatric Procedures Cause Stones?
How My Graph Works
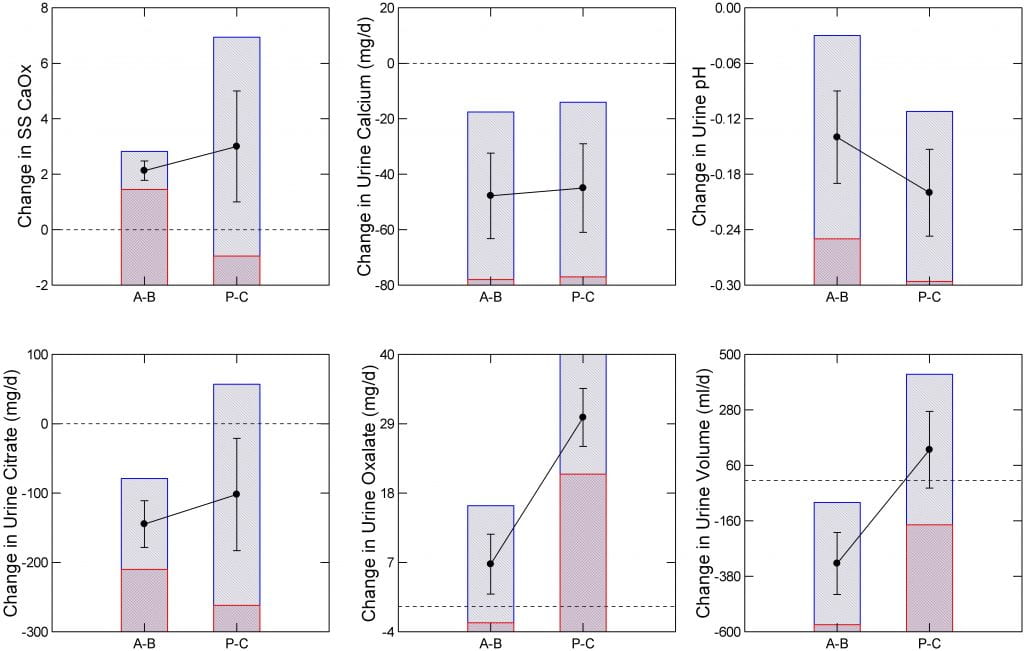
Values on the vertical axes of the graph just below are not actual urine measurements but changes, either A-B or P-C. Dots show the mean changes. The lines above and below the dots are the standard errors of the means. The blue bars show the upper to lower 95th percentiles of the means.
Bars and dots labeled A-B show changes within people: after surgery minus before surgery, so a positive number means an increase. Bars and dots labeled P-C show differences between patients who had surgery minus control subjects of equal weight who did not have surgery. The dotted lines mark changes of 0 – no change.
A significant change means the top and bottom of the blue bars are either both above 0 (an increase with surgery, or surgery higher than control), or both below 0 – a decrease with surgery or surgery lower than control.
What Surgeries Did The Patients Have?
I just presented 8 kinds of surgeries. But so large a majority of the pooled patients had RYGB the authors pooled all data, understanding that the main effects are from this one procedure. Time after surgery may affect changes in urine chemistry. For P-C comparisons, two studies fail to report the time. The other 5 intervals were (months) 6, 24, 36, 48, and 72. For A-B studies, times were 6, 6, 6-12, 12, 12, 12, and 24 months. Given 2/7 missing intervals for P-C comparisons, one cannot compare average values between the two designs. But it seems safe to say the overall average may be below one year in both.
Which Stone Risks Change?
Comparing After Surgery to Before Surgery
In the A-B, or changes with surgery groups, urine citrate and calcium excretions, urine pH, and urine volume all went down significantly – the blue bar tops and bottoms (marked here by the red crosshatching) are below the line at 0 meaning a fall. Although urine oxalate went up, the bottom 95th percentile crosses 0 so the the change is not significant. Perhaps because of the lower citrate and volume SS CaOx rose by an average of 2 units even though urine calcium fell significantly.
Comparing After Surgery to Control Subjects
In the P-C studies, urine oxalate was higher and urine pH and calcium lower in those having surgery than in comparable people who did not have surgery. Changes in citrate, urine volume and SS CaOx were not significant – bars cross the line at 0 difference. In fact, urine volume was higher on average in patients who had surgery, though the change lacked significance.
Common To Both Comparisons
A fall in urine calcium and pH occurred in both kinds of experiments. Only these two were that consistent. I presume the fall in pH reflects loss of alkali in stool as more nutrient was delivered to the colon. As for calcium, the fall must reflect lower absorption. Whether this arose from lower vitamin D levels, or reduced absorptive surface cannot be inferred from this kind of summary data. Bone mineral loss from bariatric surgery is commonplace and often ascribed to calcium malabsorption with secondary hyperparathyroidism.
The fall in urine citrate and pH probably reflects alkali loss. The NaDC1 transporter regulates citrate reabsorption subtly in response to systemic acid base change.
The Rise in Oxalate
Of all the changes, most disparate between the two kinds of experiment; look for yourself, the dots for oxalate most diverge. Even so, urine oxalate does seem to rise, and is often most focused on by physicians even though fall in citrate and pH are more consistent.
Since colectomy abolishes all enteric hyperoxaluria, we must presume delivery of increased nutrient to the colon includes more oxalate than normal for absorption. If diet calcium were abundant, perhaps enough would reach the colon to bind oxalate and prevent its absorption. Likewise for reduced diet oxalate as a synergy.
That thinking underlies our common practice of using calcium supplements and low oxalate diet for the purpose. Other long held theories, not without support from experiments, presume that bile acids and fatty acids delivered into the colon increase oxalate permeability, so lower diet fat, and drugs that might bind bile acids can play a role. Finally, agents like cholestyramine bind oxalate, and could be of use.
What is Wrong With This Analysis?
Changes are interesting, but stone risk estimates all come from 24 hour urine excretion rates. Curhan and his colleagues provided all we have of such estimates. So the changes, sans baseline measurements, have no intrinsic link to actual risk of kidney stones. Instead they offer an estimate of change in stone risk.
Diet Fat
Here, we break with the meta-analysis, to consider a marvelous publication by Dr John Fortran and his colleagues Ross Holmes and John Asplin. In a thoughtful and rather elegant study of 26 patients before and one year after RYGB Fortran shows us the power of amalgam. On one side the work is ‘Roman’ – heavy handed tables, masses of data, very much in the Dallas tradition. On the other hand, it proceeds with a subtle almost philosophical style I can only call ‘Greek’.
At issue is malabsorption of diet fat. The bariatric procedures indeed cause this, variably, and the delivery of extra fat into the colon is thought to cause undue absorption of diet oxalate. Sans colon, no humans develop hyperoxaluria from bowel malabsorption. But to understand the role of fat, we have to grapple with just what diet oxalate and urine oxalate values were before and after surgery.
An emphasis on diet fat, and on fat malabsorption, is not arbitrary. As this paper mentions in its background, the ruling theory of how malabsorption causes stones is via increase of urine oxalate, and the theory of how oxalate rises is via increased fat delivery to colon with consequent increase of colon oxalate absorption.
What Did They Do?
Objective
They wanted to test the prevailing hypothesis that RYGB raises urine oxalate excretion by increasing fatty acid delivery to the colon. In other diseases that cause fat malabsorption such as extensive ileal resection, urine oxalate correlates with fecal fat losses, and only increases if the colon is in contiguity with the nutrient stream.
If RYGB raises urine oxalate – therefore risk of kidney stones and perhaps kidney injury from excess oxalate – via increased colon fatty acid delivery then they should find a similar correlation between fecal fat output and urine oxalate excretion. But one cannot test this prediction without considering oxalate intake that itself powerfully controls urine oxalate excretion. So the correct prediction, which they employed in their work, is that urine oxalate rises with fecal fat loss after RYGB even when corrected for oxalate intake.
As a second objective they wanted to quantify fecal water losses, reasoning that such losses would lower urine volume and therefore raise urine calcium oxalate supersaturation and kidney stone risk.
Design
They enrolled 26 obese people in an elaborate protocol to measure fat balance, oxalate intake, and urine oxalate excretion before and one year after RYGB. None of the patients had formed kidney stones. To measure fat balance, patients ate a controlled diet and intake and stool losses of fat were measured in a clinical research setting. The CRC diet was made to conform with the types and amounts of food the patients had eaten during the previous 7 days. But all diets were weighed in the CRC so intake could be quantified. Patients took a 200 mg calcium supplement daily, but total calcium intake was not reported and could have varied widely.
Findings
Before surgery, because of high fat intakes, stool fat was modestly increased in 12/26 cases. Average urine oxalate excretion was quite high (61 mg/d) and varied with diet oxalate intake, but did not vary with stool fat loss. After surgery, stool fat was increased in 24/26 cases. Average urine oxalate was 69 mg/d (not a statistically significant increase) and urine oxalate excretion varied with both diet oxalate intake and stool fat loss. The authors conclude that high urine oxalate before surgery cannot be ascribed to fat malabsorption but could be due to high oxalate intake or perhaps production whereas after surgery it could reflect both high oxalate intake or production and fat malabsorption. Although diet calcium can affect diet oxalate absorption, they could not find an effect of diet calcium on urine oxalate excretion. As for their second objective, they found no effects of RYGB on stool water loss.
How I Can Best Present Their Work Here
Ideally, you can read their paper – link above. But for most that is an impossible task. So I have attempted to paraphrase the results in new figures of a more simple kind than theirs, using a more reportorial style. As well, given the importance of the work, I made my analysis slightly different from theirs, reasoning that sound conclusions will remain unchanged even when looked at from a different angle.
Transform Values to Improve Distributions
In studying the detailed figures of this important work, a certain clumping of data seemed manifest, as though the distribution of points was not very uniform throughout the rather wide ranges for diet oxalate, urine oxalate, and fecal fat losses. Sometimes that kind of distributional non uniformity reduces the sensitivity of regression analysis, so I performed my re-analysis using perhaps more uniform distributions. Mostly my figures reproduce what they found. In a few instances some minor details are slightly different.
Use Their Means Not Individual Repeated Days of Measurement
The lavish tables in the report give individual values for each of three consecutive days of study in the clinical research unit. I could have used all three in my presentation, but chose instead to use their mean values summing up all three days. One reason was to obtain a very conservative result – fewer points. Another was to avoid the need for a repeated measures analysis – to allow for internal correlations within each person that reduce the independence of the 3 days making them mathematically behave more as a unit. As a result, I have only 26 before and 26 after values for each analysis.
RYGB Affects Distributions of Oxalate Intakes and Excretions
The average urine oxalate excretion before RYGB was 61 mg/d with an intake of 235 mg/d; after, it was 69 mg/d, intake 268 mg/d. These are the same, more or less.
But a closer look at the data (Tables 2 and 3 of the paper) show differences. I have made the mean values from the tables into some graphs because of the importance of their work.
![]()
The Data Are Not Normally Distributed
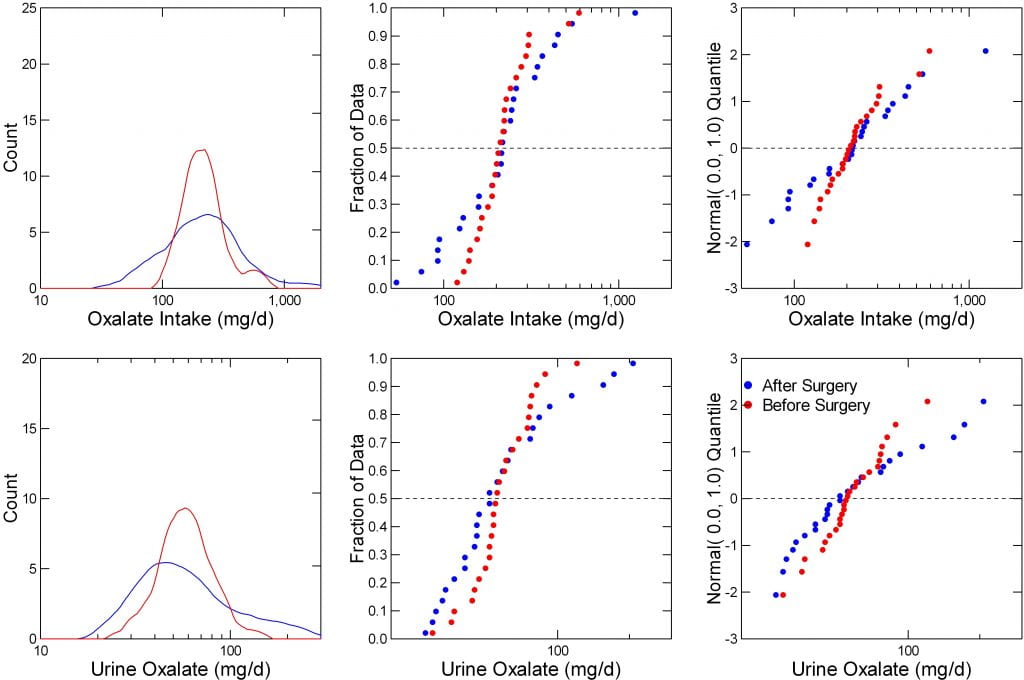
The figure to the right shows intakes and urine excretions of oxalate before (red) and after (blue) surgery in their 26 people. The left panel is a probability plot; a normally distributed measurement – like height – forms a straight line. The before surgery data do exactly that. After surgery, not at all; the data form a curve.
Urine oxalate is a lot worse; the blue – after surgery data are way off of linear – not well distributed, whereas those before surgery (red) are very well distributed.
But look. The line at 0 marks the means, and where are they? Obviously, as was already mentioned, they are more or less identical before and after surgery.
But the range after surgery is so wide and values so off of normality one might encounter possible errors when one uses these data in the kinds of correlation analyses proposed to test the hypotheses of interest. Far better to transform them.
Transform the Data
When data are far off of normal, transforming them to logarithms can help a lot. I did that here.
The left two panels show intake (top) and urine excretion (bottom) for oxalate before (blue) and after (red) the surgery. Before, the intakes are narrow and form a nice symmetrical plot with a peak around 250. But after (blue) they spread, below and above what these people were like before surgery.
The lower left panel shows urine oxalate. Surgery shifts the main peak back, lower, to the left, but adds a high right tail of higher values.
Make Diagnostic Plots
The middle plots are non parametric ‘Q’ plots, simple positioning of successively higher values. They tell the same story, but with more verve. Surgery widens the range of intakes and excretions without much altering the midpoints (medians, at 0.5, or 1/2 way through each plot).
Finally, the probability plots are repeated here (left panels). Unlike the raw data, when transformed the results are rather normal in distribution. The blue (after surgery) points span a wider range but pivoting about the same mean as the before surgery (red) points.
RYGB Alters Dependency of Urine Oxalate on Intake
Urine Oxalate vs. Intake
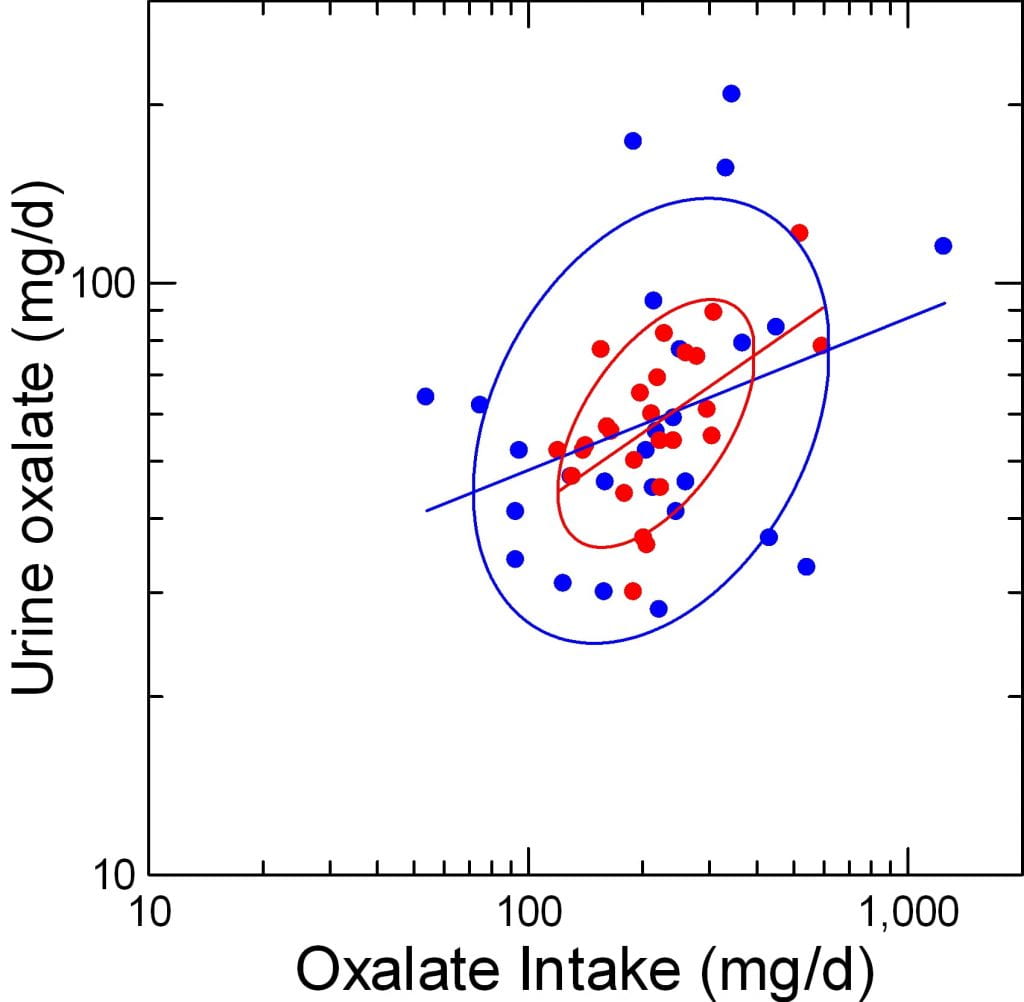
Here, urine oxalate (vertical axis) is plotted against the diet oxalate intake (horizontal axis), both logarithmically transformed. As before, red is before blue after surgery. The ellipses are non parametric – they incorporate 68% of the area covered by points. The lines are simple least square regressions.
To my eye, urine oxalate indeed varies closely with diet intake before surgery; see the narrow ellipse pointing upward to the right. After surgery (blue) the ellipse widens into nearly a circle. The regression line after surgery is less tilted than before, as if for a given intake we get less oxalate out into the urine. But more important, the widening of the ellipse suggests the actual correlation has much lessened.
Statistics
If urine oxalate is made the dependent variable in a general linear model (it could be an ANOVA, too) it varies strongly with oxalate intake (F=7, p=0.007).
In that ANOVA, the slope dependency is not different between the pre and postoperative periods (p=0.45).
But, If I compute the actual linear regression coefficients, the one for after surgery is statistically not significant: 0.446, p=0.003 and 0.257, p=0.11, before and after surgery.
So surgery disrupts the relationship between urine oxalate and diet oxalate intake.
Summary of Oxalate Handling
RYGB does not cause hyperoxaluria.
Mean values for urine oxalate do not change because of the surgical procedure. This agrees with what the meta-analysis reported for A-B (after vs before) changes in individual patients.
RYGB distorts the physiology of oxalate handling.
For a given intake the amount of oxalate in the urine is less dependent on diet oxalate after RYGB than before – the surgery disrupts rather than heightens dependency of urine oxalate on oxalate intake. One would have predicted that fat malabsorption from RYGB would increase the dependency by somehow facilitating oxalate absorption.
Why Should RYGB Cause Kidney Stones?
Since RYGB does not actually raise urine oxalate, why then the insistant emphasis on urine oxalate when the subject turns to bariatric surgery?
Of course, because urine oxalate is high. We do not care that it was high before surgery, that period of life is over for patients. The high urine oxalate is perhaps like a fixed stone risk factor to which RYGB may add lower urine citrate and volume so the three taken together foster stones.
It is also possible that this work repeated with stone formers would show a rise of urine oxalate from RYGB. This was not the case in the meta-analysis, however.
What About Fat?
We have established on these pages the critical linkage – and its loss after RYGB – between oxalate intake and excretion. The wonderful data in the paper show us how increased fat delivery to the colon, marked by fecal fat losses, affects that linkage.
Transform the Data
![]() Here are the diagnostic plots again. What we care about is now much fat appears in the stool because that is the fat the colon encounters. The idea is fat affects things in the colon so oxalate gets absorbed more efficiently.
Here are the diagnostic plots again. What we care about is now much fat appears in the stool because that is the fat the colon encounters. The idea is fat affects things in the colon so oxalate gets absorbed more efficiently.
Untransformed – as is – fecal fat is so abnormally distributed after surgery (blue) one should not completely trust its use in correlation analyses. Transformed, both before (red) and after (blue) the data are normally distributed – to the eye at least, and one can see the offset – how much higher it is after surgery.
Plot Urine Oxalate Against Fecal Fat Loss
![]()
Surely this plot must convince you that fat delivery to colon affects urine oxalate excretion.
First, the two ellipses that contain the before and after (red and blue) points float more or less at about the same average urine oxalate. This repeats what we have said before: RYGB does not increase mean urine oxalate excretion.
But urine oxalate obviously varies with fecal fat after surgery (blue points) yet hardly does so before. The blue ellipse is narrower than the red, and points upward and to the left far more than the red one.
Even so, the red ellipse does tilt up and to the right, too. So we need to quantify the difference.
Statistics
Simple Regressions
More formally, in a simply correlation study, before surgery urine oxalate (log transformed) varies with oxalate intake and not with fecal fat (r= 0.55 and 0.31, p=0.0.01 and 0.36, oxalate intake, and fecal fat, respectively). Whereas, after surgery, things are reversed (r=0.32 and 0.656, p=0.33 and 0.001, oxalate intake and fecal fat, respectively).
Let me summarize this. Urine oxalate varies with oxalate intake, not fecal fat, before surgery, and with fecal fat, not oxalate intake, after surgery.
Multivariable Regression
In a general linear model, urine oxalate as dependent variable (all are log transformed here) varies with fecal fat (F=14, p<0.001), but not at all with diet oxalate (F=3.73, p=0.059). The mean adjusted values for urine oxalate before and after RYGB do not differ significantly (F=3.92, p=0.053).
I should mention, again, that I have used only the mean values from the tables in the paper, whereas they authors used values from all three days of their study – many more points. But in their analysis I did not find adjustment for repeated measures. So my more austere approach may not be much off from what they would have found.
Either way, RYGB creates a strong dependency of urine oxalate on fecal fat, as predicted by the original hypothesis, and more or less abolishes dependency on diet oxalate within the ranges available in their experiment.
What About Calcium?
In other settings, higher diet calcium lowers urine oxalate. One might expect something similar here. Of course, things are complicated because patients received calcium supplements, but only 0.2 gm/d, whereas calcium intakes normally run 3 to 5 times that amount. Since the tables give mean intakes before and after surgery, we added it to our presentation.

The Distribution is Not Very Abnormal
Unlike for oxalate and fat, the distribution after RYGB (Blue) was very straight when plotted against the normal function (graph to the left). Before surgery 4 patients deviated remarkably to the right – high values – no doubt from diet extremes or supplements not known about. Log transformation that so improved matters for oxalate and stool fat made no difference.
Does Urine Oxalate Vary with Calcium Intake?
A Graph
Before RYGB (red points) one can see no relationship at all between urine oxalate, plotted on a log scale and diet calcium. The ellipse is flat, indicating no slope dependency. After RYGB (blue points) the ellipse does appear to tilt downward and to the right as if more calcium intake might reduce urine oxalate.
Correlations
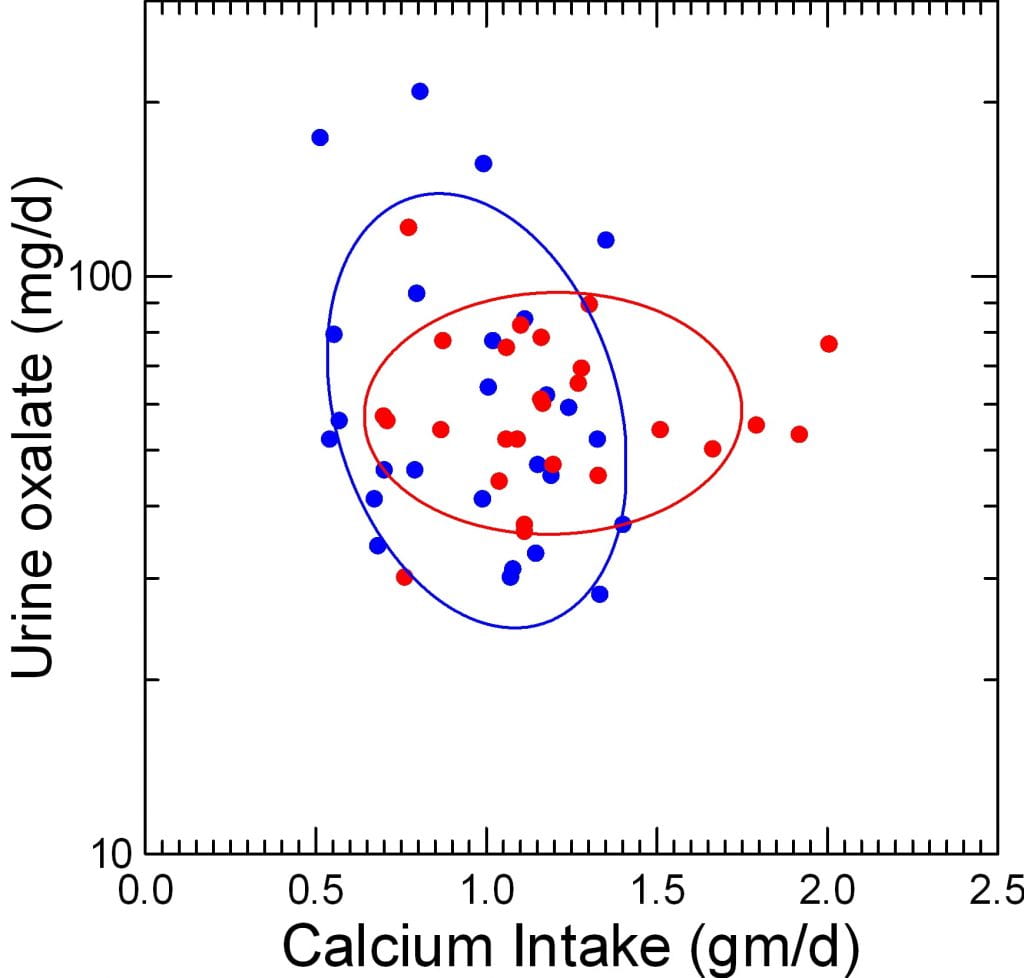
In a simple correlation matrix including logs of diet oxalate, urine oxalate loss, and stool fat loss, calcium intake (not log transformed) had no significant correlation with anything except – strangely and unsuspected – fecal fat (before surgery r=0.45, p=0.02; after, NS). The correlation between urine oxalate and calcium intake was negative after surgery (-0.25), microscopic before surgery (r=0.024) and not significant on either occasion. This accords well with the graph to the right.
Multivariable Anova
But in an ANOVA with log urine oxalate as the dependent variable, logs of oxalate intake and fecal fat loss, and untransformed diet calcium as covariates, calcium intake does matter.
As before, urine oxalate strongly depends on fecal fat loss (F=18, p<0.001), and on oxalate intake (F=5.4, p=0.024). But calcium intake matters (F=5.6, p=0.02) and adjusted urine oxalate now differs significantly between surgery and before (48.8 vs 69.3, after vs. before, F=7.7 p=0.008).
The effects model – the final one for this work, is also of interest.
| FACTOR | Log10 Urine
Oxalate |
| Constant | 1.055 |
| Oxalate Intake | 0.222 |
| Fecal Oxalate | 0.376 |
| Calcium Intake | -0.166 |
| Surgery | -0.076 |
| No Surgery | 0.076 |
If we remain in log units to simplify things, a unit change of oxalate intake adds 0.22 to the 1.055 constant (about 11 mg if transformed) or about 20%, whereas a unit of fecal fat adds about 37%, and a unit of diet calcium subtracts about 16%.
Surgery subtracts about 7.6%, no surgery adds that much, so the swing between them is about 15.2%. This is not an odd finding; fully adjusted urine oxalate is lower after surgery than before.
The effects of calcium and oxalate intake and of fecal fat do not vary between surgery and before (cross products within model). Perhaps they might if I used the full data set of 3 days per person, perhaps not if I allow for repeated measures.
But even if detectable, those effects will probably be rather weak as none of the three cross products have significance even when added one at a time to the model. This means that the slope dependencies of urine oxalate on oxalate intake, fecal fat, and diet calcium do not vary detectably with surgery.
What About Their Test of the Fat Hypothesis?
The imagined physiology – theory – holds that delivery of fat into the colon will increase urine oxalate; the test is whether urine oxalate will vary with fat delivery, as gauged by fecal fat losses, after surgery. The answer is yes. Because oxalate intake also matters, one has to account for its effects which they and I did via simple ANOVA and general linear model analysis. The answer remains yes.
But it is a complex yes. One envisions that if fat simply raised the efficiency of oxalate absorption, for any given increment of oxalate intake urine oxalate would rise more. So after surgery, when urine oxalate is dependent on fat delivery to the colon, one should find an increased sensitivity of urine oxalate to diet oxalate. We found instead the precise opposite – urine oxalate no longer depends on diet oxalate whether one uses simple correlations or formal multivariable methods, or just looks at a graph of the data themselves.
So, I am not so sure about the proposed physiology. But that does not matter as they did the work and are experts about fat whereas I did not and am not. Even so, one can have some second thoughts and wonder what is really happening.
What About Treatment?
Fat Intake
Before surgery, I see little meaning in reducing it. After, however, everything alters, and we would be wise to reduce it as much as possible consistent with adequate nutrition. The surgery, by permitting fat to get into the colon, disrupts the normal relationship between urine oxalate and oxalate intake replacing it with a more vigorous relationship between urine oxalate and fat delivery to colon (thence to stool).
Oxalate Intake
Formally speaking, one should be very wary before surgery and control it as much as possible. After surgery, it seems to have little effect. We need real trial data here, however, as things are very complex with RYGB. Clinically, I would be careful of intake as before surgery but wonder why.
Calcium Intake
Despite the complex environment, the experiment reveals a negative or moderating effect of diet calcium on urine oxalate, so high calcium intake can be recommended here as in most high urine oxalate conditions.
Stone Prevention
General Measures
Many sources detail an approach more or less consistent with what I have just mentioned. A recent long but commonplace compendium proposes sipping fluids so as to maintain urine volume despite a restricted stomach, increased diet calcium – or calcium supplements – to help bind oxalate in colon, and perhaps potassium citrate to counter the lower urine pH and citrate levels. No stone trial data are quoted, presumably because few exist. This report also details the bone disease, secondary hyperparathyroidism, and other complications far beyond the present article.
A far more elegant and intellectual review of enteric hyperoxaluria from all causes likewise highlights the benefits of high diet calcium along with reduced diet fat and oxalate, and the possible benefits of alkali supplements to raise urine citrate.
Specific Approach
Bariatric patients require diet management and monitoring from the surgical team for a wide range of issues that extend far beyond stone prevention. So in reality someone concerned with stone prevention can affect only those few critical factors related to stones themselves and only in collaboration.
Urine Volume
Urine volume needs to be above 2.5 liters/d as in any stone former. If I can achieve it, I will. When restrictive surgery limits fluids, constant sipping is a realistic alternative.
Urine Citrate
I see no reason to omit potassium citrate supplements if urine citrate is below the stone risk threshold of 450 mg/d and the alternative of more fruits and veggies fails to work given the altered bowel function.
Diet Oxalate
Obese patients with stones seem to have high urine oxalate at least in part from high diet oxalate intake. After surgery the effect of diet pales compared to effects of fat, but as I mentioned above the goal of less than 150 mg/d of diet oxalate is reasonable.
Diet Calcium
Given hyperoxaluria – very likely – I try to use high calcium foods as I do in all cases, timing them with larger meals or meals that will contain appreciable oxalate. If food calcium is not possible I use supplements timed in the same manner. Diet oxalate is best below 100 mg/d if that permits adequate intake of fruits and veggies.
Diet Fat
Diet fat is as important after surgery, as unimportant before surgery. That is a remarkable lessen from a wonderful research article I spent a lot of your reading time on. Diet fat reduction depends upon general nutrition. When possible I aim for it.
Great article! Made me do a little article research and confirmed that given high urinary oxalate, supplementing calcium carbonate (TUMS) at mid meal (when half of the plate has been eaten) would reduce urinary oxalate excretion. So this could work synergistically with the high calcium diet and calcium supplements.
Hi Dr Murua, A calcium supplement at the larger meals should be helpful, as would a high calcium diet. No real trials here for bariatric patients but lots of observations and a good rationale. I always recheck 24 hour urines to be sure about the calcium level from the supplements; sometimes it can get too high. Warm regards, Fred
I am one-year post gastric bypass surgery and just found out I have numerous stones in both kidneys (As I write this, I am waiting for a 9mm stone to “pass”!) I have been diligent about my fluid intake, but it looks like I need to improve in other areas. Thanks you for helping me learn more about why my body is doing what it’s doing!
Hello, I have recently been diagnosed with Enteric Hyperoxaluria and am 12 year post RYGB so this article was very illuminating. I have had 2 kidney stones removed in a year which is why they did urine test for Hyperoxaluria. Is it unusual to take such a lengthy time to develop Enteric Hyperoxaluria after RYGB?
Hi N. Thornton, I imagine your urine oxalate rose some time after your procedure and contributes to the stones. Urine citrate often falls, as well, and adds to the risk. Risk of stones and stones themselves is like risk of car theft and having your car stolen: the one raises risk but timing is not predictable. Treatment is often successful as outlined in the article and I would pursue it. Regards, Fred Coe
I am 12 years post DS-BPD. And yes, I’ve developed stones. For the last two years, my doctors and I have been basically doing everything you suggest. Although I have cut my oxalates dramatically, they are still technically high (dropped from a high of 195 to 60-70 on a consistent basis). The only thing left for me to tweak a bit more would be fat (which is tough given the dairy). What do you consider a low fat diet? 25% of calories? 10% of calories (that is unsustainable for me)? A set amount of mg per day? Also, if it comes to a tradeoff between low fat and low oxalate, would you advocate low fat over low oxalate?
Hi W.J., I am glad the oxalate came down from so high a value and I agree it is important to try to lower it a bit further. But your physicians have done very well indeed. A useful addition is calcium supplements with the main meals, which will bind oxalate even more and reduce absorption. They can measure urine calcium and be sure the level is not rising. Low fat beats low oxalate every time. The exact level is complex and your physicians have to work that out given your total nutrition. Regards, Fred Coe
Thank you for this. I’m 2 years post RYGB and recently diagnosed with multiple bilateral kidney stones… right side is finally cleared after 4 surgeries, left side is behaving for now, but still has multiple stones. My 24 hr urine oxalate is high (previously snacked on almonds to help boost protein intake and had raspberries nearly daily and substituted spinach for leafy greens for added nutrients- I had never heard of oxalate prior to this!). In addition, my 24hr urine sodium is high. Total volume was over 6L… I’ve always been able to keep up with fluids. Is it possible that eliminating what I thought was healthy habits (almonds, raspberries and spinach) could be the key to never forming another stone?
Hi Alison, RYGB is really complex. Fluids and potassium citrate to raise urine citrate are common measures. Of course, lowering any obvious diet oxalate loads may help. But the situation is complex enough that I have trouble making specific suggestions apart from your physicians doing what seems reasonable given your stone composition and 24 hour kidney stone risk findings and using lots of follow up 24 hour urine measurements to tell them if things are going in the right direction. Regards, Fred Coe
Hi, I’m 45 years post JIB, Payne method side to side. I’m following this issue as few MD s remain that understand or grasp the long term consequences of JIB. So far no diagnosed stone formations, but I stopped potassium citrate supplementation the first year, relied on modified diet by trial and error. if you follow any other JIB resources or survivors pls let me know where that info is published
Hi CT, I wrote what I know into the article. I do not personally study the bypass patients specially but we have a young physician at UC with a special interest should you need her help (Dr Megan Prochaska). It sounds like things have gone well, and perhaps you need nothing more. Best, Fred Coe
I had to have part of my ascending colon removed in April because of a 3.6 centimeter precancerous polyps and partial blockage. I am a diabetic and metformin usually causes very loose bowel movements. I also take acarbose, insulin and recently started ozempic.
The surgery has caused some foods that never gave me a problem before, now are causing terrible diarrhea.
Nearly ten years ago my left kidney formed lots of stones. I ended up with a stent to push the stone back into the kidney and relieve the blockage. Then two lithotripsies, the stent removal and then another blockage.
Last week I landed once again in the ER with stones again. A KUB done at the time of surgery showed I was still stone free at that time.
I take medication for gout and was told 9 years ago to add back some of the foods I had stopped eating because they were so high in oxalates.
This time the stones passed in about 3 days, but during that time, I am vomiting, have severe diarrhea and can’t keep down anything in my stomach.
I have an appointment with my Urologist next month and PCP next week.
Can this be caused from the surgery?
Hi Charlene, I suspect the new stone was uric acid – very important to have that checked. If so, you will need alkali.Loss of colon can also lead to calcium stones because of dehydration – the stone analysis will help here. In either case 24 hour urine testing will reveal all possible causes, and lead to a reasonable treatment plan. You really do need such testing. Gout itself associates strongly with uric acid stones, as does diabetes, so if I had to guess that would be your most likely outcome. Get the 24 hour urines (2) before the appointment, so the time will not be futile. Regards, Fred Coe