
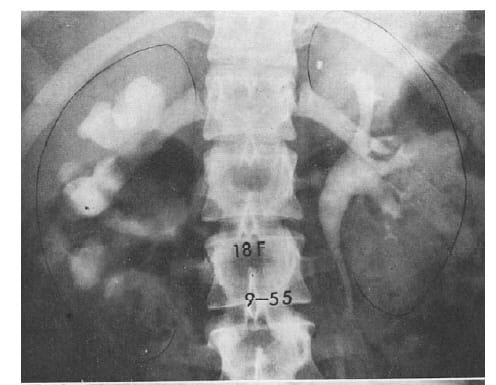
The old fashioned intravenous pyelogram pictured in the header of this article depicts the normal left kidney of an 18 year old woman, and her severely obstructed right kidney – from a stone. That kidney has lost some of its tissue.
In his review of stone pain, Mike Borofsky showed that obstructing the kidney of an animal reduces its function and provokes inflammation. Obstructing stones affect human kidneys similarly, and can damage them, but we know fewer details.
Fortunately, kidneys seem resilient enough that most stone formers maintain reasonable kidney function. But stone formation not rarely leads to kidney disease. Though often mild, in some cases losses can be severe, even to kidney failure.
What do we know about the commonplace kidney obstruction from stones?
For example: When obstruction leads to loss of kidney tissue, is the loss repaired? When stone obstruction reduces kidney function, how much does function recover? How long is safe to let an obstructing stone pass on its own?
Lost Kidney Tissue is Not Replaced
One needs to ask at the very beginning if lost kidney tissue grows back. If not, then the loss from an episode of obstruction is once and for all. Given that nephrons of adults do not regenerate, this question rests on an assumption: loss of mass may not always reflect loss of nephrons but of cell mass that could, in principle rebuild itself.
An Example of Normal and Obstructed Kidneys
Here is the header picture of an 18 year old woman in whom a stone had obstructed the right ureter ‘…in the past.’ Nothing now obstructed that kidney.
 She is one of 25 patients reported in a remarkable long term observation asking if lost kidney tissue is replaced.
The Normal Kidney
Her left kidney shows a curving, rounded renal pelvis merging into the ureter. It is white because contrast material has been injected intravenously.
From the pelvis three stems – major calyces -extend toward the kidney papillae and end at tulip shaped ‘minor calyces’ that form a cup around the papillae.
The distance between the middle calyx and the outer rim of the kidney is used to measure the thickness of the kidney tissue. Radiologists adjust for the magnification of the image as we cannot do here.
Grades of Obstruction
Radiologists and urologists grade obstruction. A simple version is mild, moderate and severe.
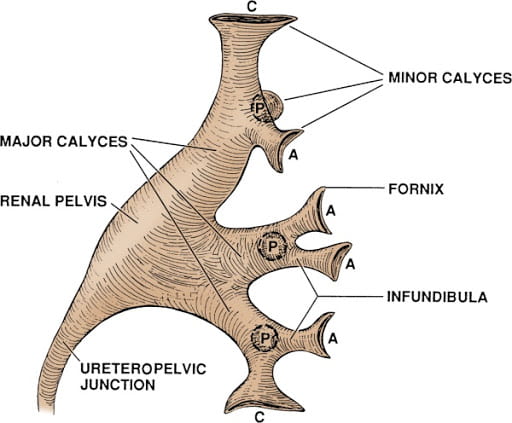 Mild is flattening of the pelvis and the major calyces – loss of their usual contour, and a loss of the waist slimming of the infundibulae. You can see infundibulae in the drawing but not in the x ray that shows only one minor calyx draining into each major calyx. Whether or not the kidney tissue has thinned from its normal of 2.4 – 2.6 cm is not considered.
Moderate means dilation of the pelvis and ballooning of the calyces with thinning of the kidney tissue – 1.8 – 2.3 cm.
Severe is a grossly dilated pelvis and calyces with marked thinning and marked loss of kidney tissue – 0.6 -1.5 cm.
In all cases ascribed to stones, one must see the stone on the dilated side and have convincing reasons – usually obvious – to assume the stone is causing the obstruction.
The simple grading system I put here is from a conventional radiology study. Although other authorities divide obstruction into 4 or even 5 grades based on more minor details, for our purposes three grades will do.
Take note that both moderate and severe mean thinning of kidney tissue – loss of substance. As well, loss of tissue may or may not be present in mild obstruction.
Obstruction in this Example
The right kidney shows severe obstruction. The pelvis and calyces are massively dilated. Between the middle calyx and the kidney’s edge (outlined in ink) lies less space on the right than on the left. That lessened space marks kidney tissue lost.
Magnitude of Tissue Loss In All 25 Cases
For all 25 patients, the authors provide a measure, in cm, of the thickness of kidney tissue between the collecting system and the outer edge of the kidney at its middle point, just as in the picture.

In this figure, thickness of the abnormal side is plotted on the vertical axis against that of the normal side on the horizontal axis. Women are in red, men blue. The line of identity runs diagonally. Points below that line mean loss of tissue.
We have no idea about how long the obstruction lasted because the authors do not say. But we do know all the obstructions were from stones.
This work was published in 1971, and one should say that stone removal was much less advanced than now. Instruments were clumsier and surgery more complex. Therefore we might guess that stones were left to pass on their own much longer than we would do now.
But that is conjecture.
What we do have is a careful assessment of whether kidney tissue lost from stone obstruction is replaced in patients whose obstructing stones were removed. The figure shows how much was lost in each patient.
Sex Differences
Women seemed to fare worse than men. You can see that in the first graph. The red points lie more below the line of identity than the blue points.
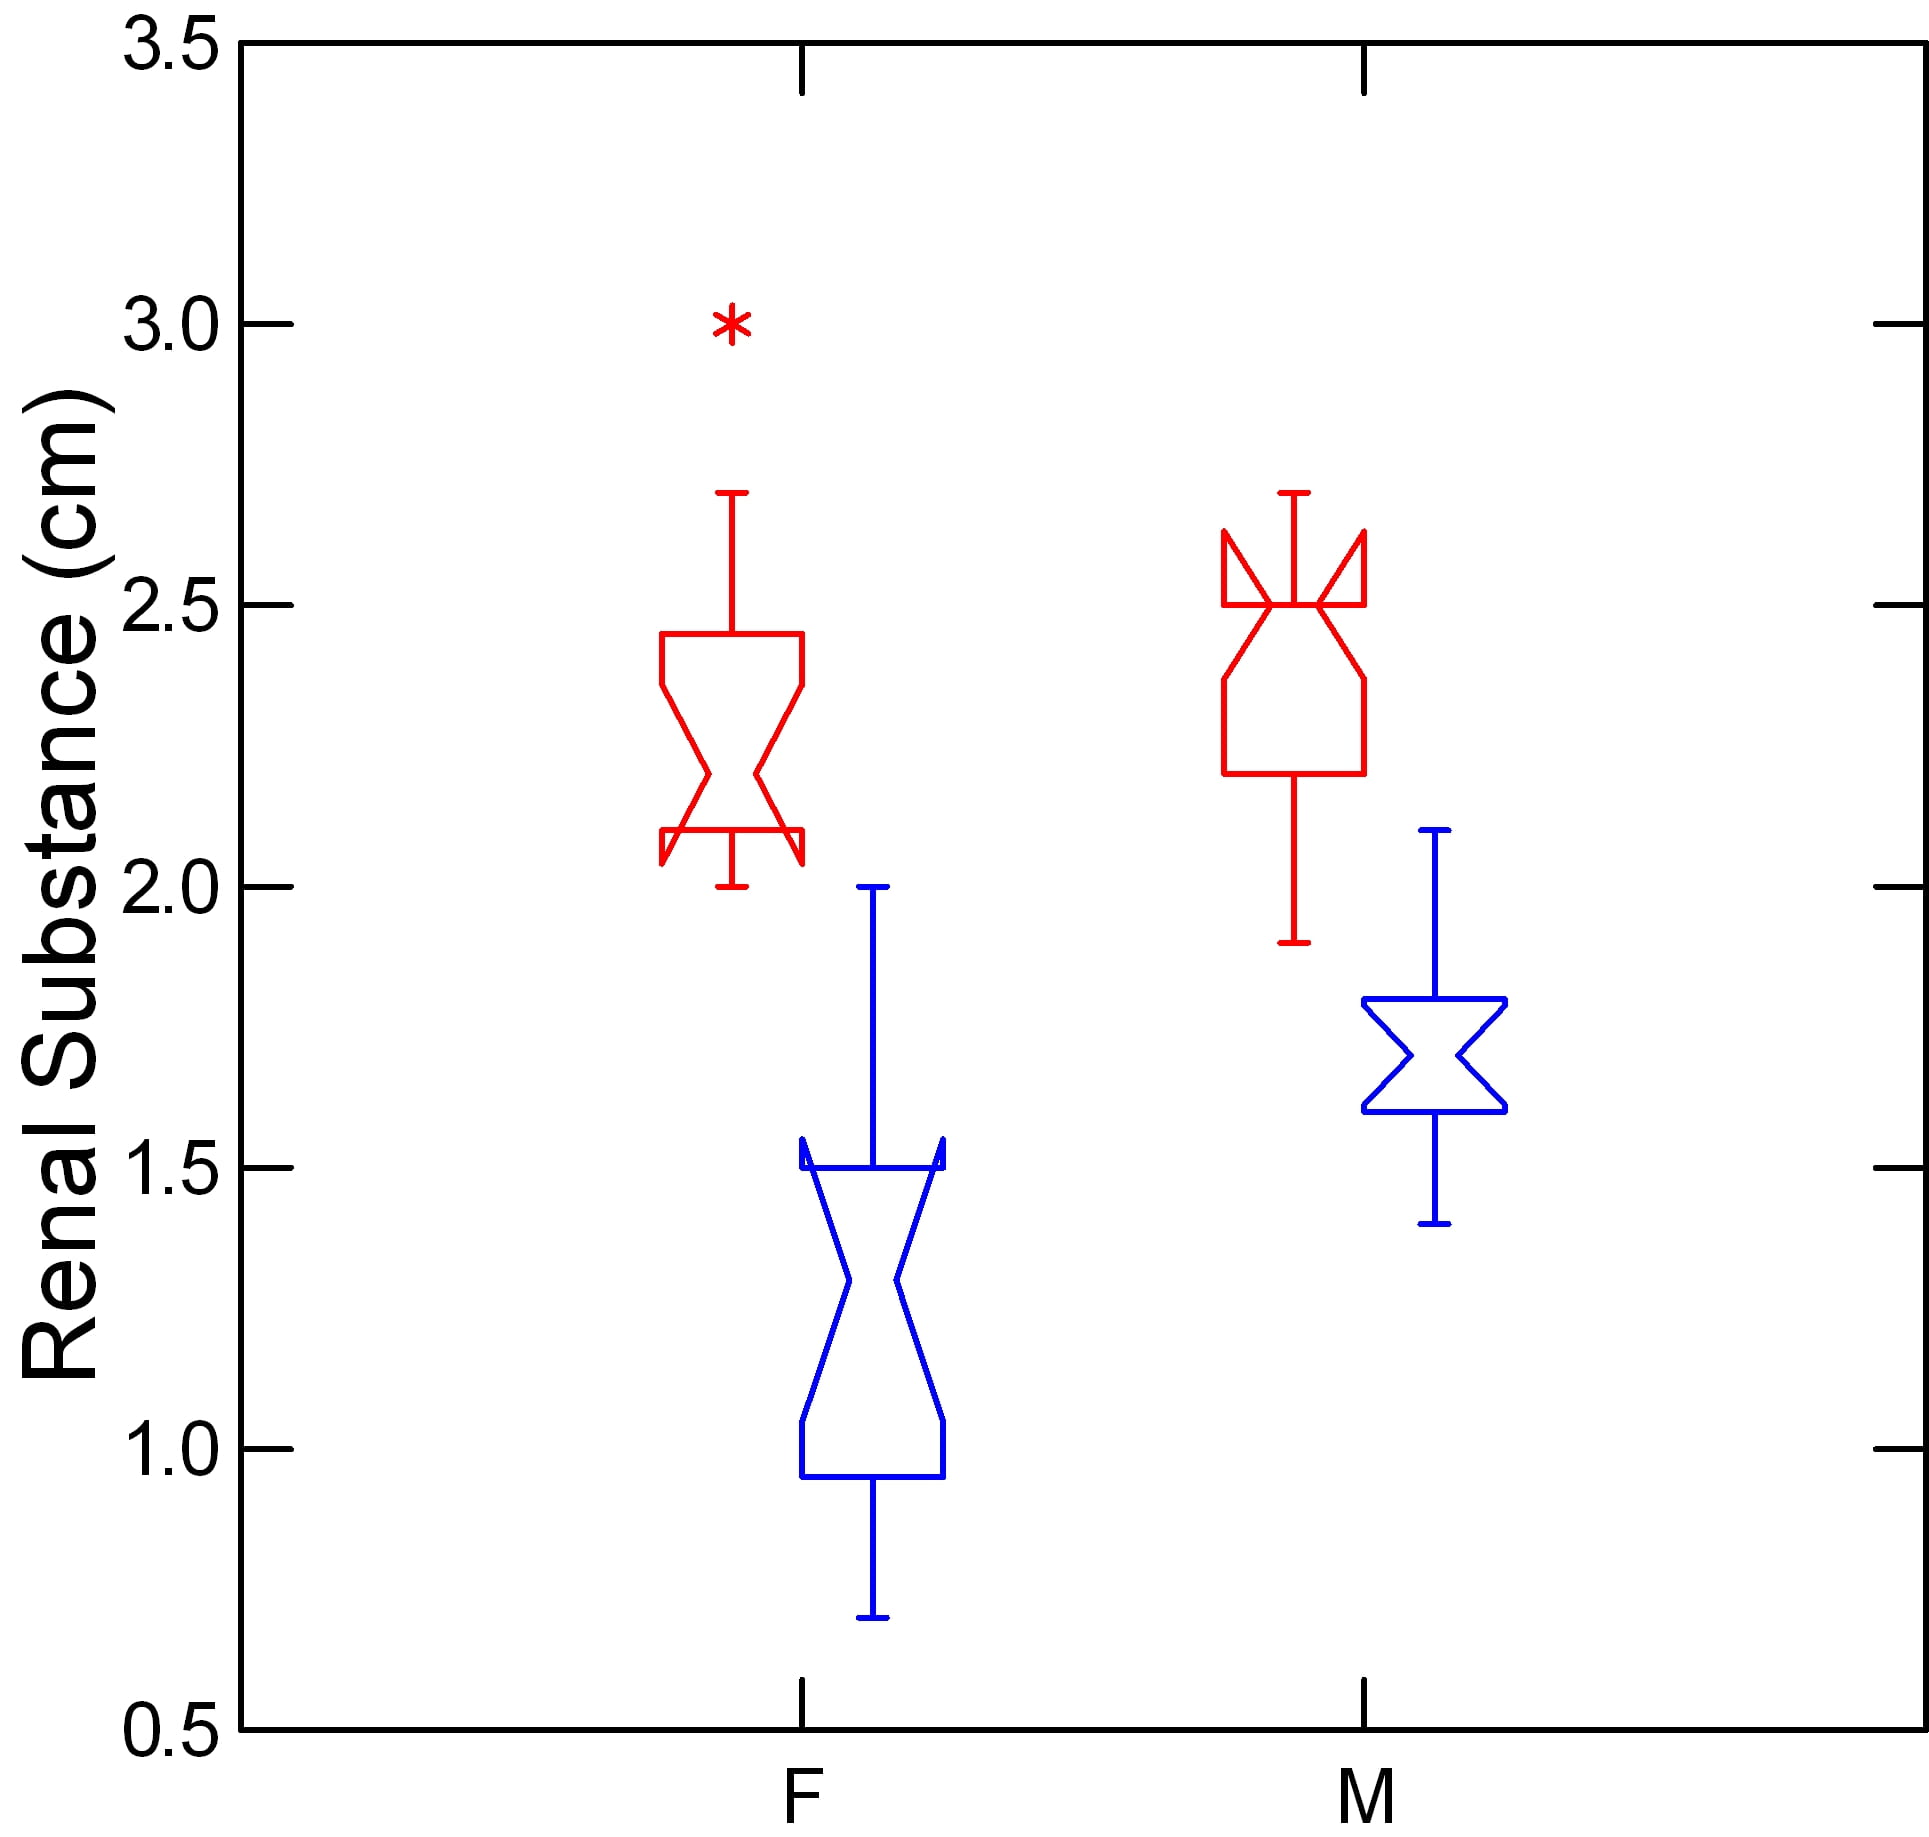
In this graph, I show the averages by sex to make the sex different clearer.
The red upper notched boxes show the unobstructed kidneys from both sexes. The notches (the 95% CI for the median tissue thickness – at the narrow belt line of the waist) overlap meaning that normal tissue thickness was not different between women and men.
On the obstructed sides, in blue, the median thickness – narrow waist – was much lower, and the upper ends of the boxes did not overlap with the bottoms of the normal sides, meaning the differences between obstructed and normal kidneys are highly significant statistically within each sex.
There is also a sex difference.
The female blue box lies below the blue male box, and the skirt of the blue male box does not fall below the top of the blue female notch. This means the female average tissue thickness is statistically below the male on the obstructed sides.
Of course we do not have the times for the obstruction, so perhaps the females were left longer before stone surgery. Alternatively, possibly, renal mass is lost more in women with obstruction.
The one thing that is not a reason is a baseline difference in renal tissue thickness. Kidney tissue thickness of the unobstructed kidneys was the same in women and men – upper red boxes overlap.
The message thus far is plain enough. Obstruction from stones can cause loss of kidney tissue, and women may lose more tissue than men.
Change in Tissue Thickness With Time
The patients had new intravenous pyelograms between 7 months and 15 years after their first, so changes in tissue thickness could be measured.
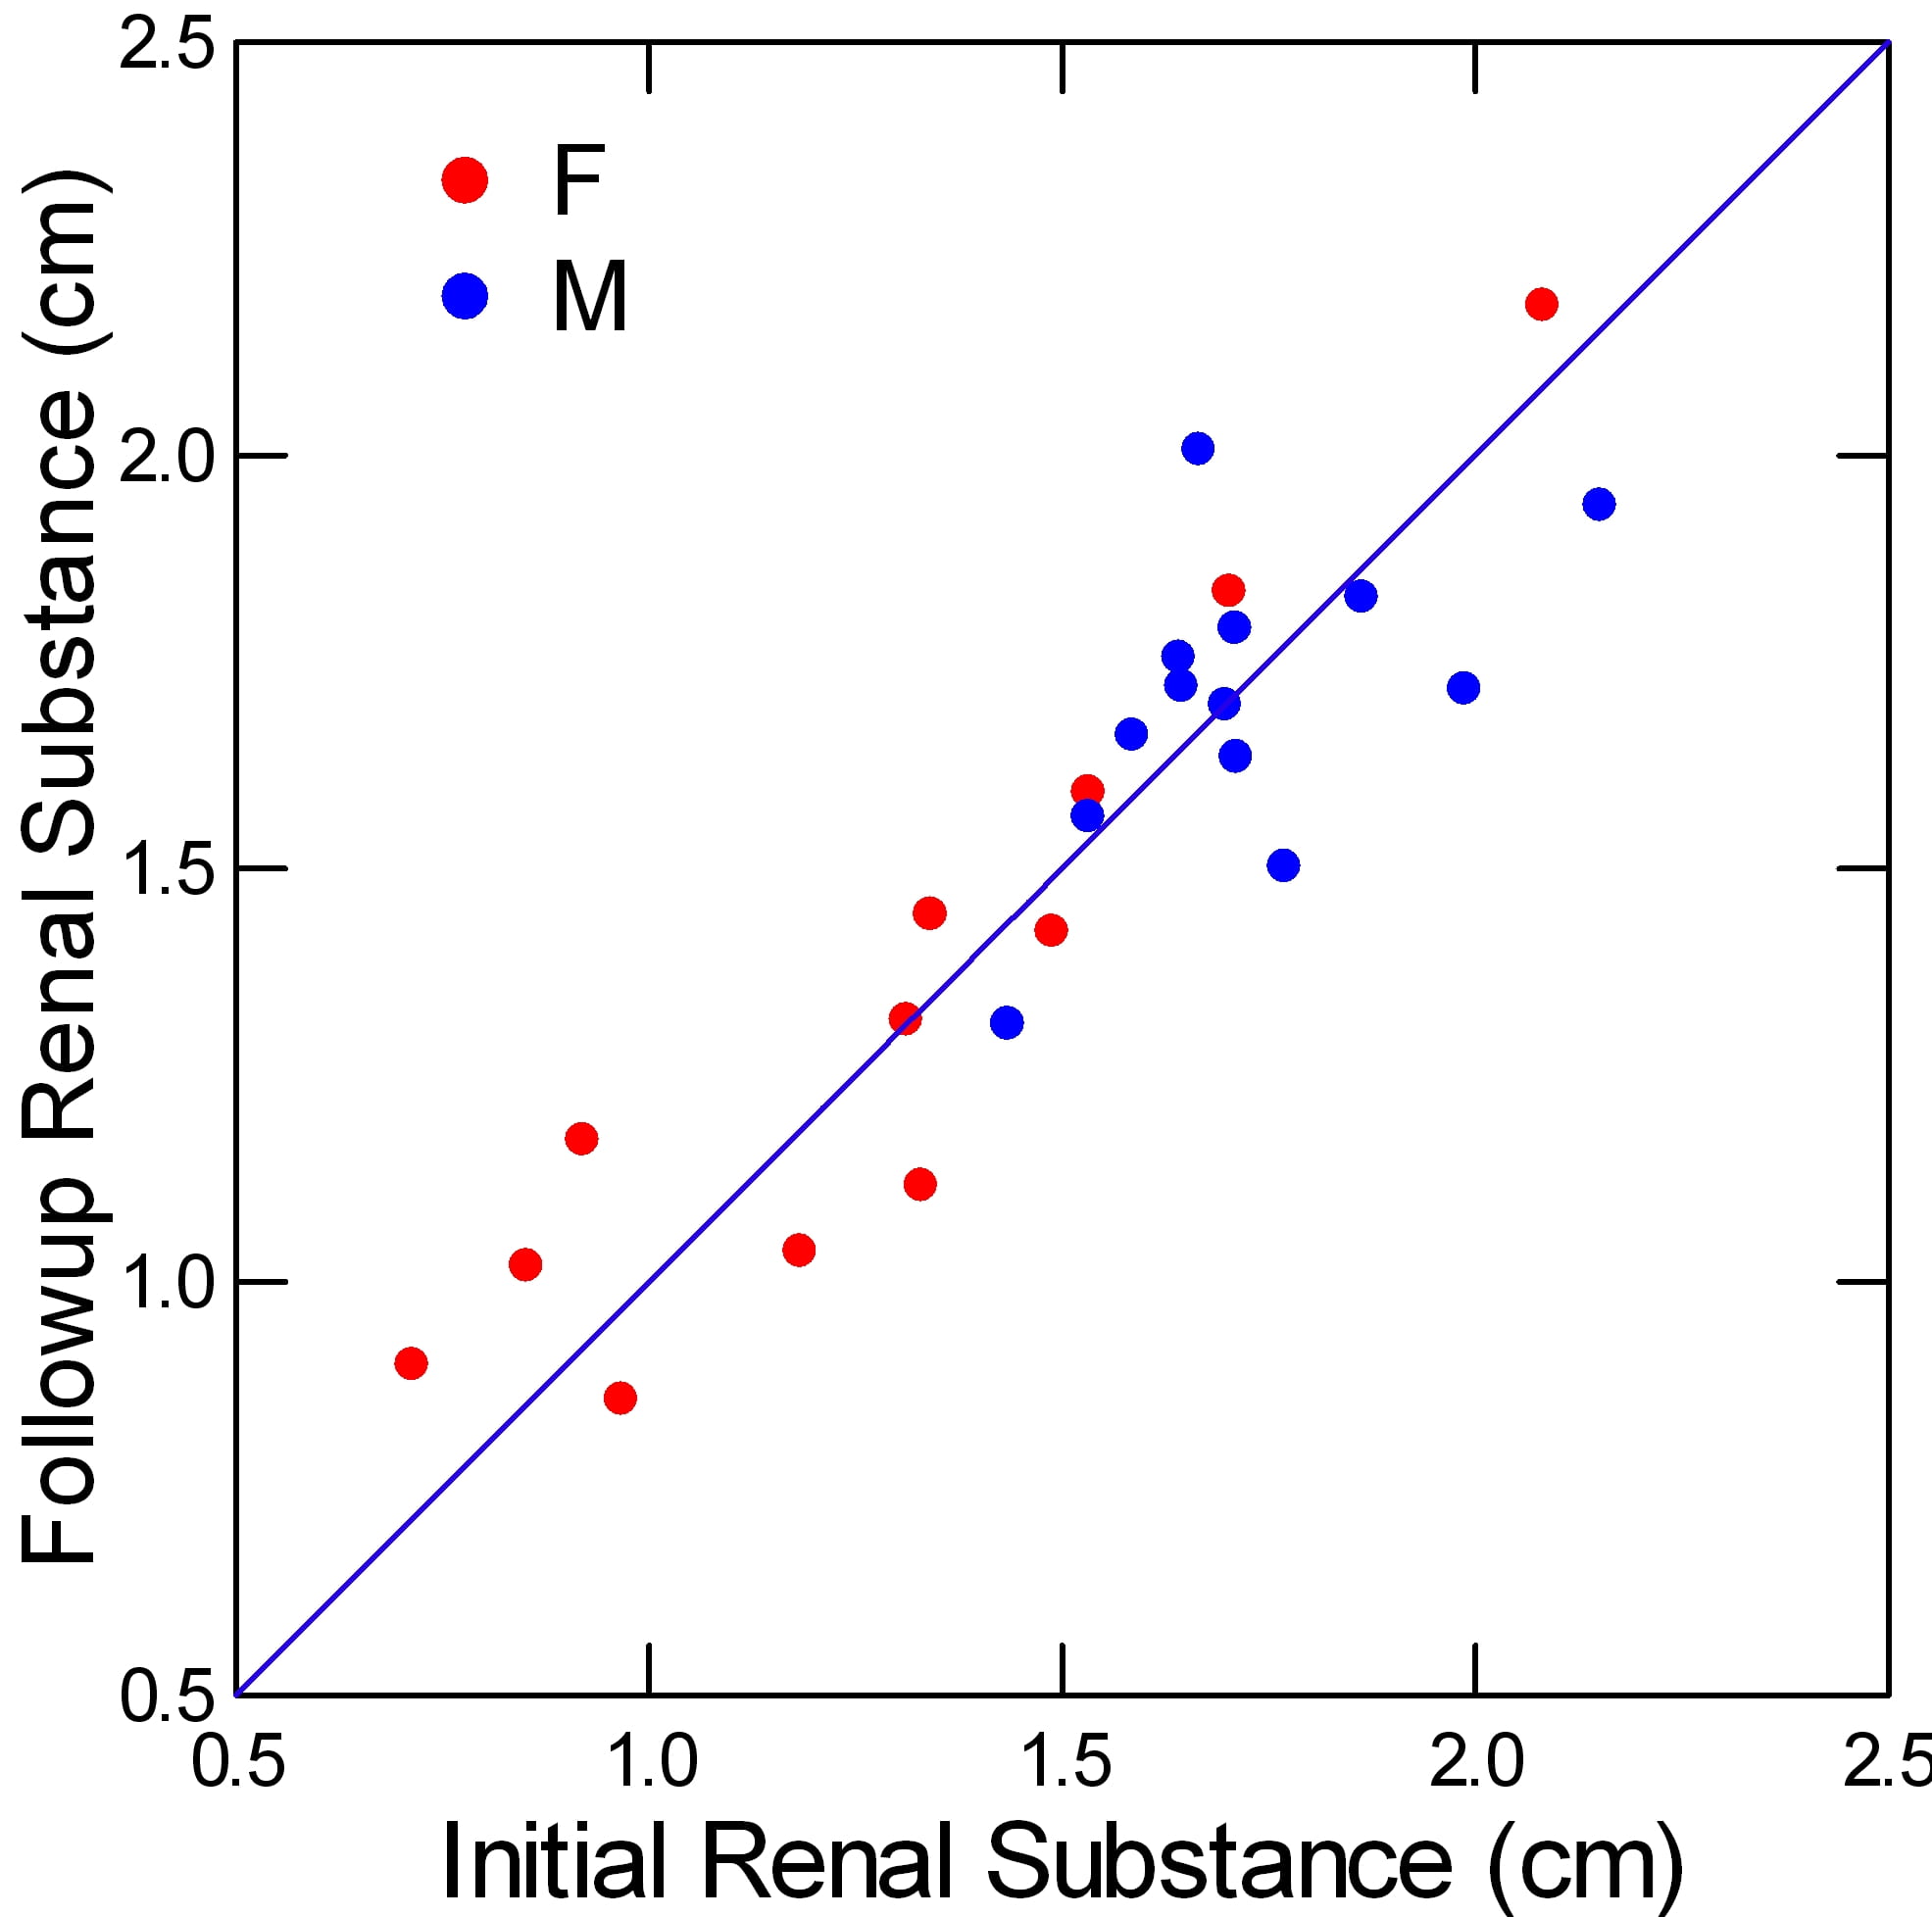
The second measurement is plotted on the vertical axis against the initial measurement on the horizontal axis. The line of identity runs along the diagonal.
What is most obvious is how well the points align along that line of identity, both women (red) and men (blue). No substantial changes occurred either for better or for worse. That means no renal substance regenerated.
It is most compatible with the idea that lost tissue is lost nephrons. Alternatively, even if it is not all lost nephrons, lost cell mass of existing nephrons does not replace itself.
Either way, kidney tissue lost from obstruction does not return.
It is a glum and warning message: Lost is lost. We need to avoid tissue loss from kidney stone obstruction.
At this point I often say one needs more data, and this important clinical finding should be tested by more research. Of course, another long term study would be welcome. If it differed from this one – lost kidney regenerates – I would rejoice. I think regeneration is unlikely.
Obstruction Reduces Kidney Function
Modern 320 row CT scanners can image the movement of contrast agents into and through the renal tissues and urinary tracts of the two individual kidneys in patients, and give estimates of blood flow and transport from blood into tissue. This study used such technology to estimate effects of obstruction by stones.
Who Was Studied
Sixty-four consecutive patients with obstruction were enrolled between January 2013 and September 2013. The patients included 25 females and 39 males with a mean age of 48 ± 4 years (range, 20–78 years). 20 sex- and age-matched individuals (mean age, 45 ± 8 years (range, 23–74 years) served as controls. All but three of the obstructions were due to kidney stones. Obstruction was graded as mild in 26 patients, moderate in 22 patients, and severe in 16 patients. NB: subject description is redacted directly from the paper, for convenience.
What Was Measured
The chemical used for imaging (N,N’-Bis (2,3-dihydroxypropyl)-5-[N-(2-hydroxyethyl) glycolamido] -2,4,6-triiodoisophthalamide) is similar to that used in conventional renograms. It is filtered by the renal glomerulae and also secreted by kidney cells from blood into urine. So the agent marks a combination of filtration and renal blood flow.
The time density curve for movement of the contrast material could be determined for any particular region of interest (ROI) in the kidneys. Blood flow (BF), defined as the flow rate through the vasculature in a given tissue region, could be measured from the time density curve of a particular ROI.
Using a graphical solution of an equation that relates flow to the volume of blood and ‘clearance of the contrast from blood into the tissue, the authors could derive blood volume and clearance for any ROI. Flows and clearance are in ml//min per 100 ml of tissue volume within the ROI. Blood volumes are in ml/100 ml of tissue volume within the ROI.
Clearance has a special meaning here. It is not renal clearance as usually stated. Rather it is the movement of the contrast material from the blood compartment into the tissue and tubule fluid compartment – a marker of secretion and filtration combined.
What was Found
Blood Flow

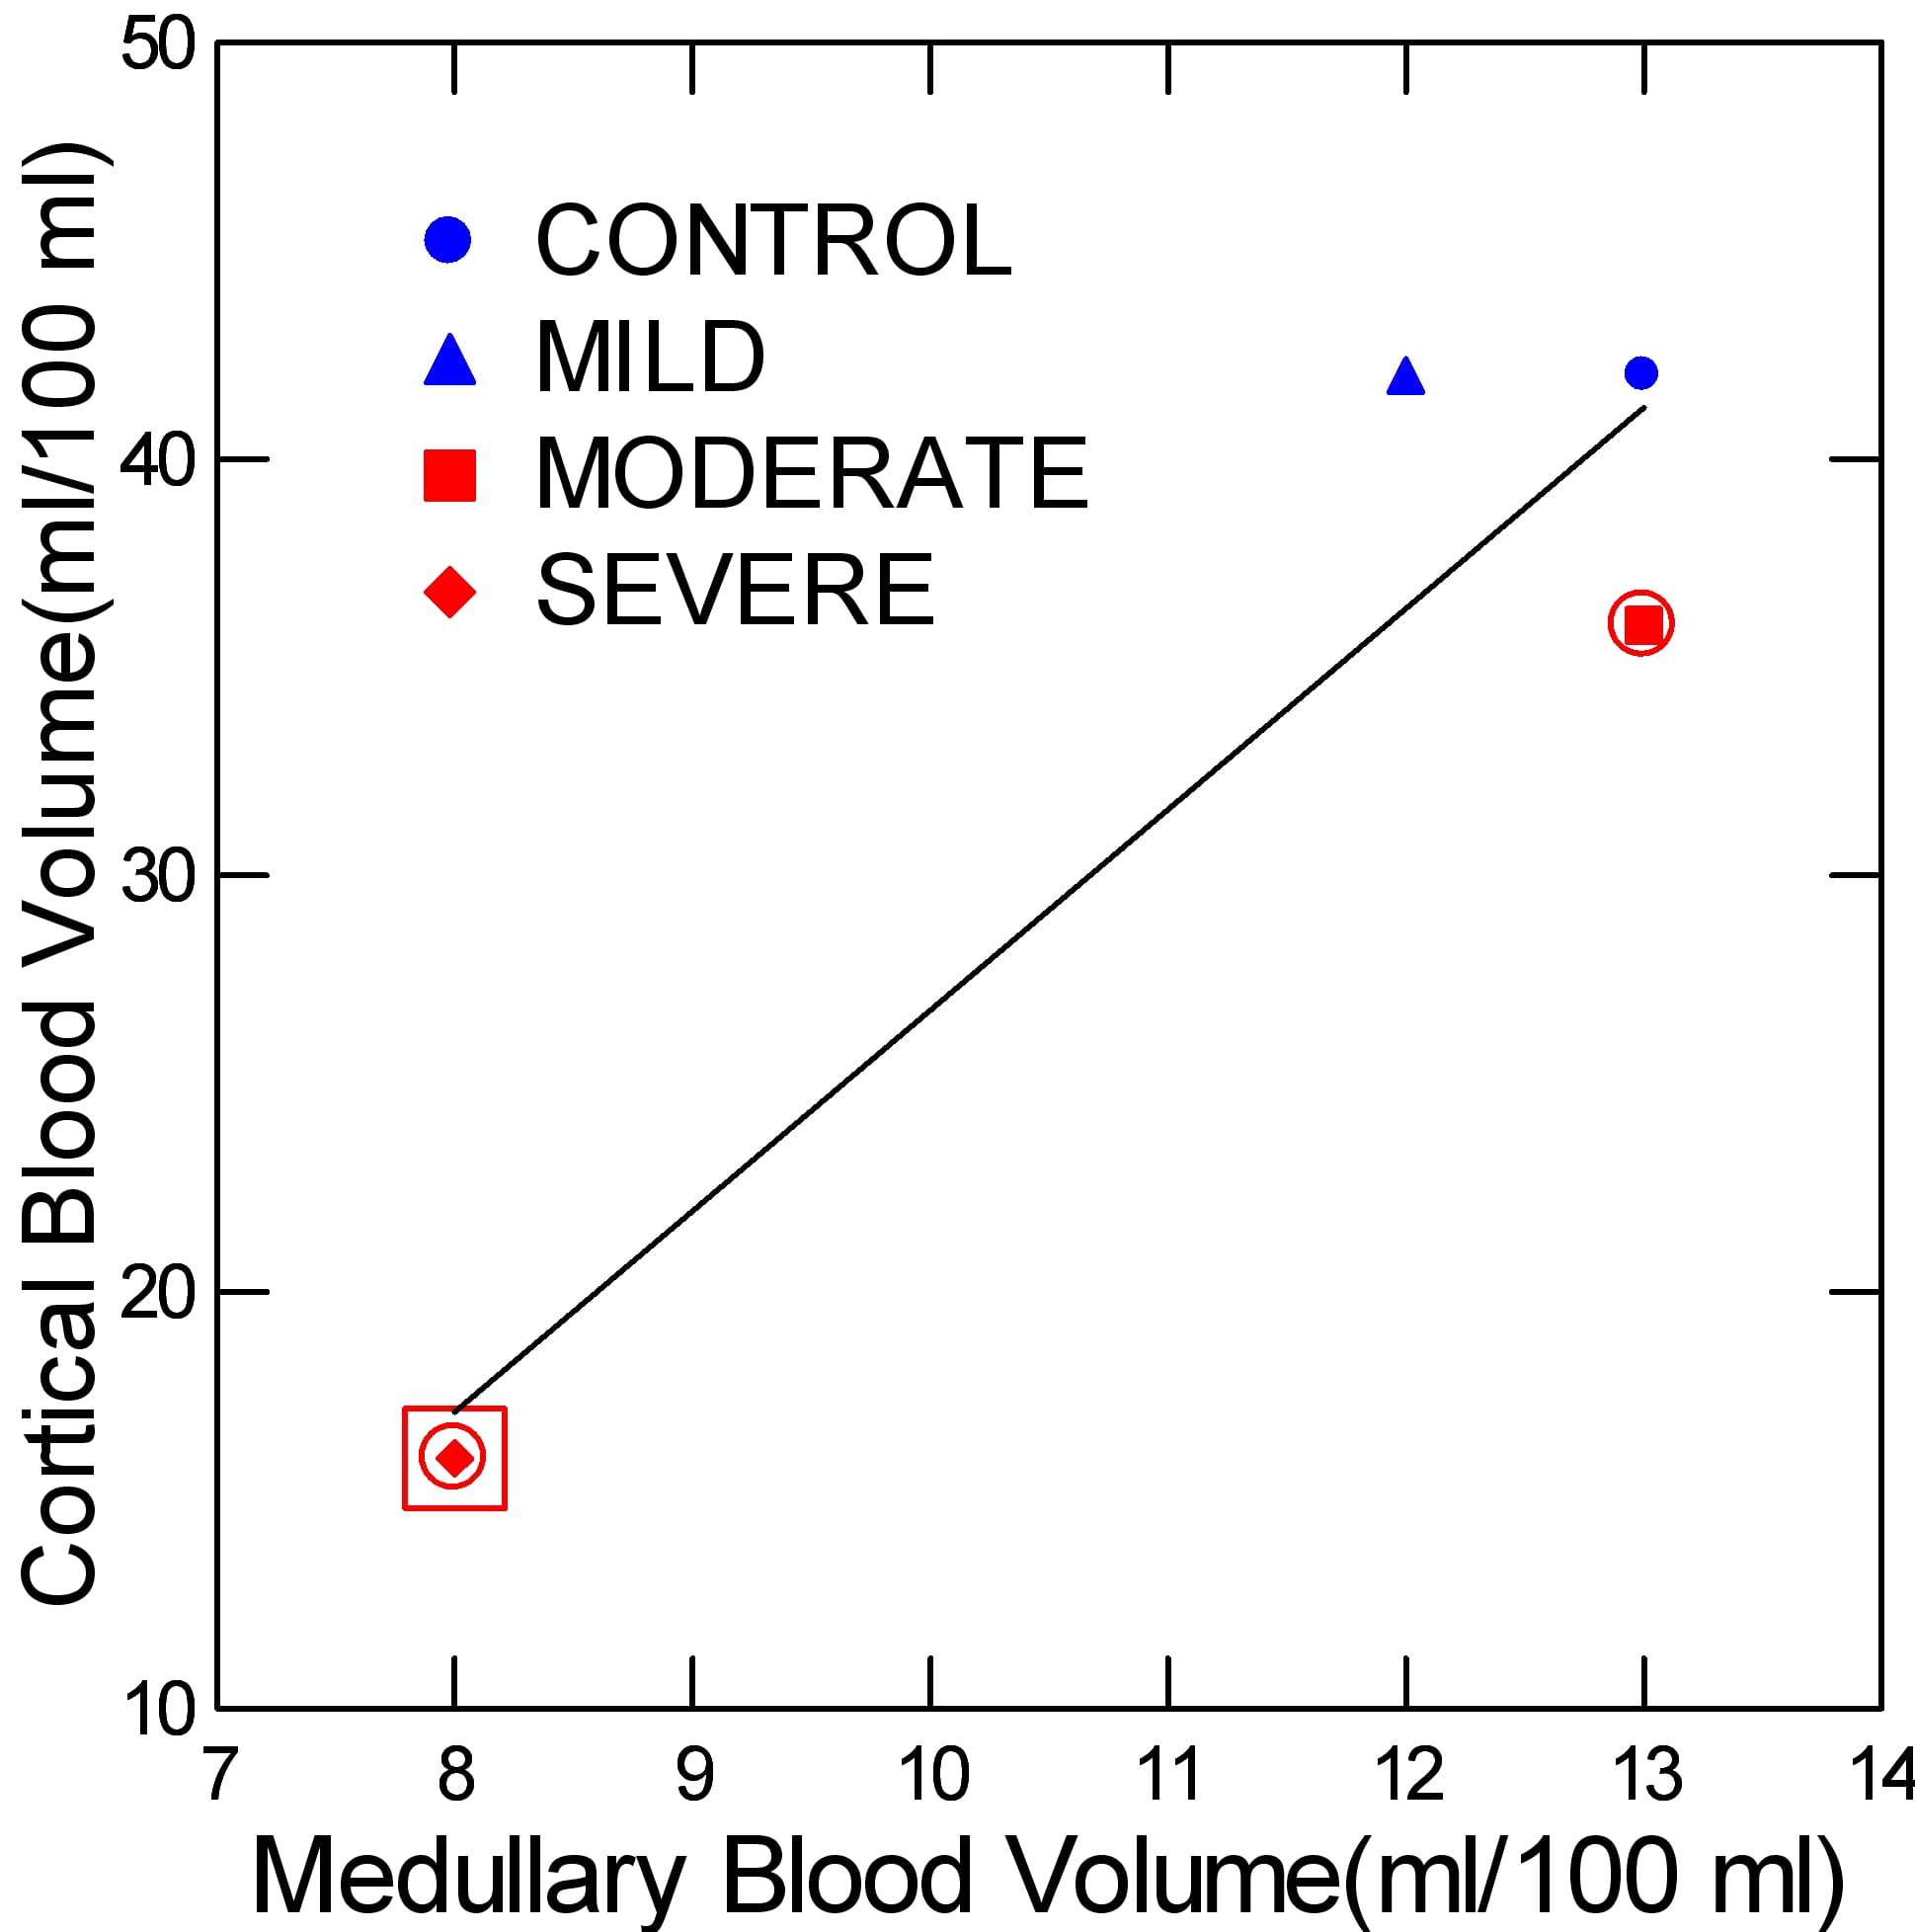
The graph at the left shows the blood flow through the kidney cortex (where glomerulae are) plotted against blood flow in the medulla – where the loops of Henle and the collecting ducts are, and where plaque forms.
Control refers to the group of normal people who were studied as comparators to patients. Mild, moderate, and severe obstruction are as I have already described them.
Each point is the mean for its subject group.There was generous variability around each mean, but I omitted the confidence lines for visual clarity and put in their stead significance symbols.
Circles around points means they differed from their normal unobstructed paired kidney. Large boxes mean they differed from control kidneys.
Moderate and severe obstruction reduced flow to the cortex and medulla, and they fell in proportion to each other. In the cortex, that means glomerular flow is reduced. Leaving the glomerulus, that same blood nourishes the kidney tubule cells.
Marked reduction of blood flow can lead to cell damage or death. Less flow means less delivery of nutrients and oxygen. It makes cells vulnerable to injuries from other causes such as drugs, or marked dehydration that further lowers blood flow throughout the body. For example, the vomiting and dehydration stone pain often causes can worsen blood flow, and promote more kidney injury. Sepsis, not rare with obstruction, or from the surgery needed to cure it, likewise compromises renal circulation.
Quite possibly, tissue loss from obstruction arises from lower blood flow.
Blood Volume
The volume of blood contained within a given 100 ml of tissue visualized by CT imaging was distinctly low only in severe obstruction. In moderate obstruction, the value was low vs. the normal paired kidney, but not against the kidneys of normal people. The graph does not depict the normal of each pair, for visual clarity.
To understand this measurement, think about kidneys as they are in life. They lie less than a foot below the heart, and with each heartbeat expand as blood flows into them. This expansion is the filling of their capillaries and arteries with blood.
With obstruction, blood flow falls, and with it the organ deflates. It does not fill with each heartbeat as when normal. So we are looking at another view of the loss of circulation.
Clearance
![]()
Clearance reflects movement of the tracer from the blood compartment – capillaries – into the tubule fluid and tissues. As such it depends on blood flow but also on the cell secretion of tracer from blood into the tubule fluid and therefore on cell energetics.
At first glance, the points seem to make a progression, falling from control through each level of obstruction. I suspect this is in fact the case.
But the confidence around these points are very generous, so the only point below controls and the normal kidneys is for severe obstruction.
One might ask about the significance of reduced clearance. To me it indexes cell vitality. Falling values suggest secretion is reduced as well as blood flow. We could use more studies like this one, in humans, that measure effects of obstruction on renal function.
Conclusion
Mild obstruction does not seem to affect blood flow or contrast secretion. Whether this means it is benign, causing no injury, remains uncertain.
Moderate and severe obstruction are worrisome. Low renal blood flow eventually must compromise kidney cells, and that is probably the reason that moderate and severe obstruction not uncommonly coexist with loss of renal mass.
Reduced blood flow, as already mentioned, means that common pharmaceuticals used in stone disease – contrast agents, non steroidal pain medications, some antibiotics – are more likely to cause outright acute kidney injury.
Acute Kidney Injury During Stone Passage
While this kind of labor intensive study may be of mainly research interest, at least one publication I have found offers a more pragmatic and possibly useful parallel.
What Was Measured
The authors gathered all patients who had CT urograms between July 2010 and January 2014 and had unilateral obstruction from passing stones, a normal contralateral kidney, and follow up serum creatinine measurements after complete resolution of the obstruction as defined by radiological criteria.
They found 94 subjects, 59 males, mean age 53 yr, having excluded patients with chronic kidney disease, loss of kidney tissue, or abnormal renal vasculature.
The CT scans were performed at a mean of 2.3 days after onset of symptoms, and the mean time to resolution of obstruction was 3.4 days. Patients had serum creatinine values just before the CT study in all cases, and follow up values at least one week after complete resolution of the obstruction.
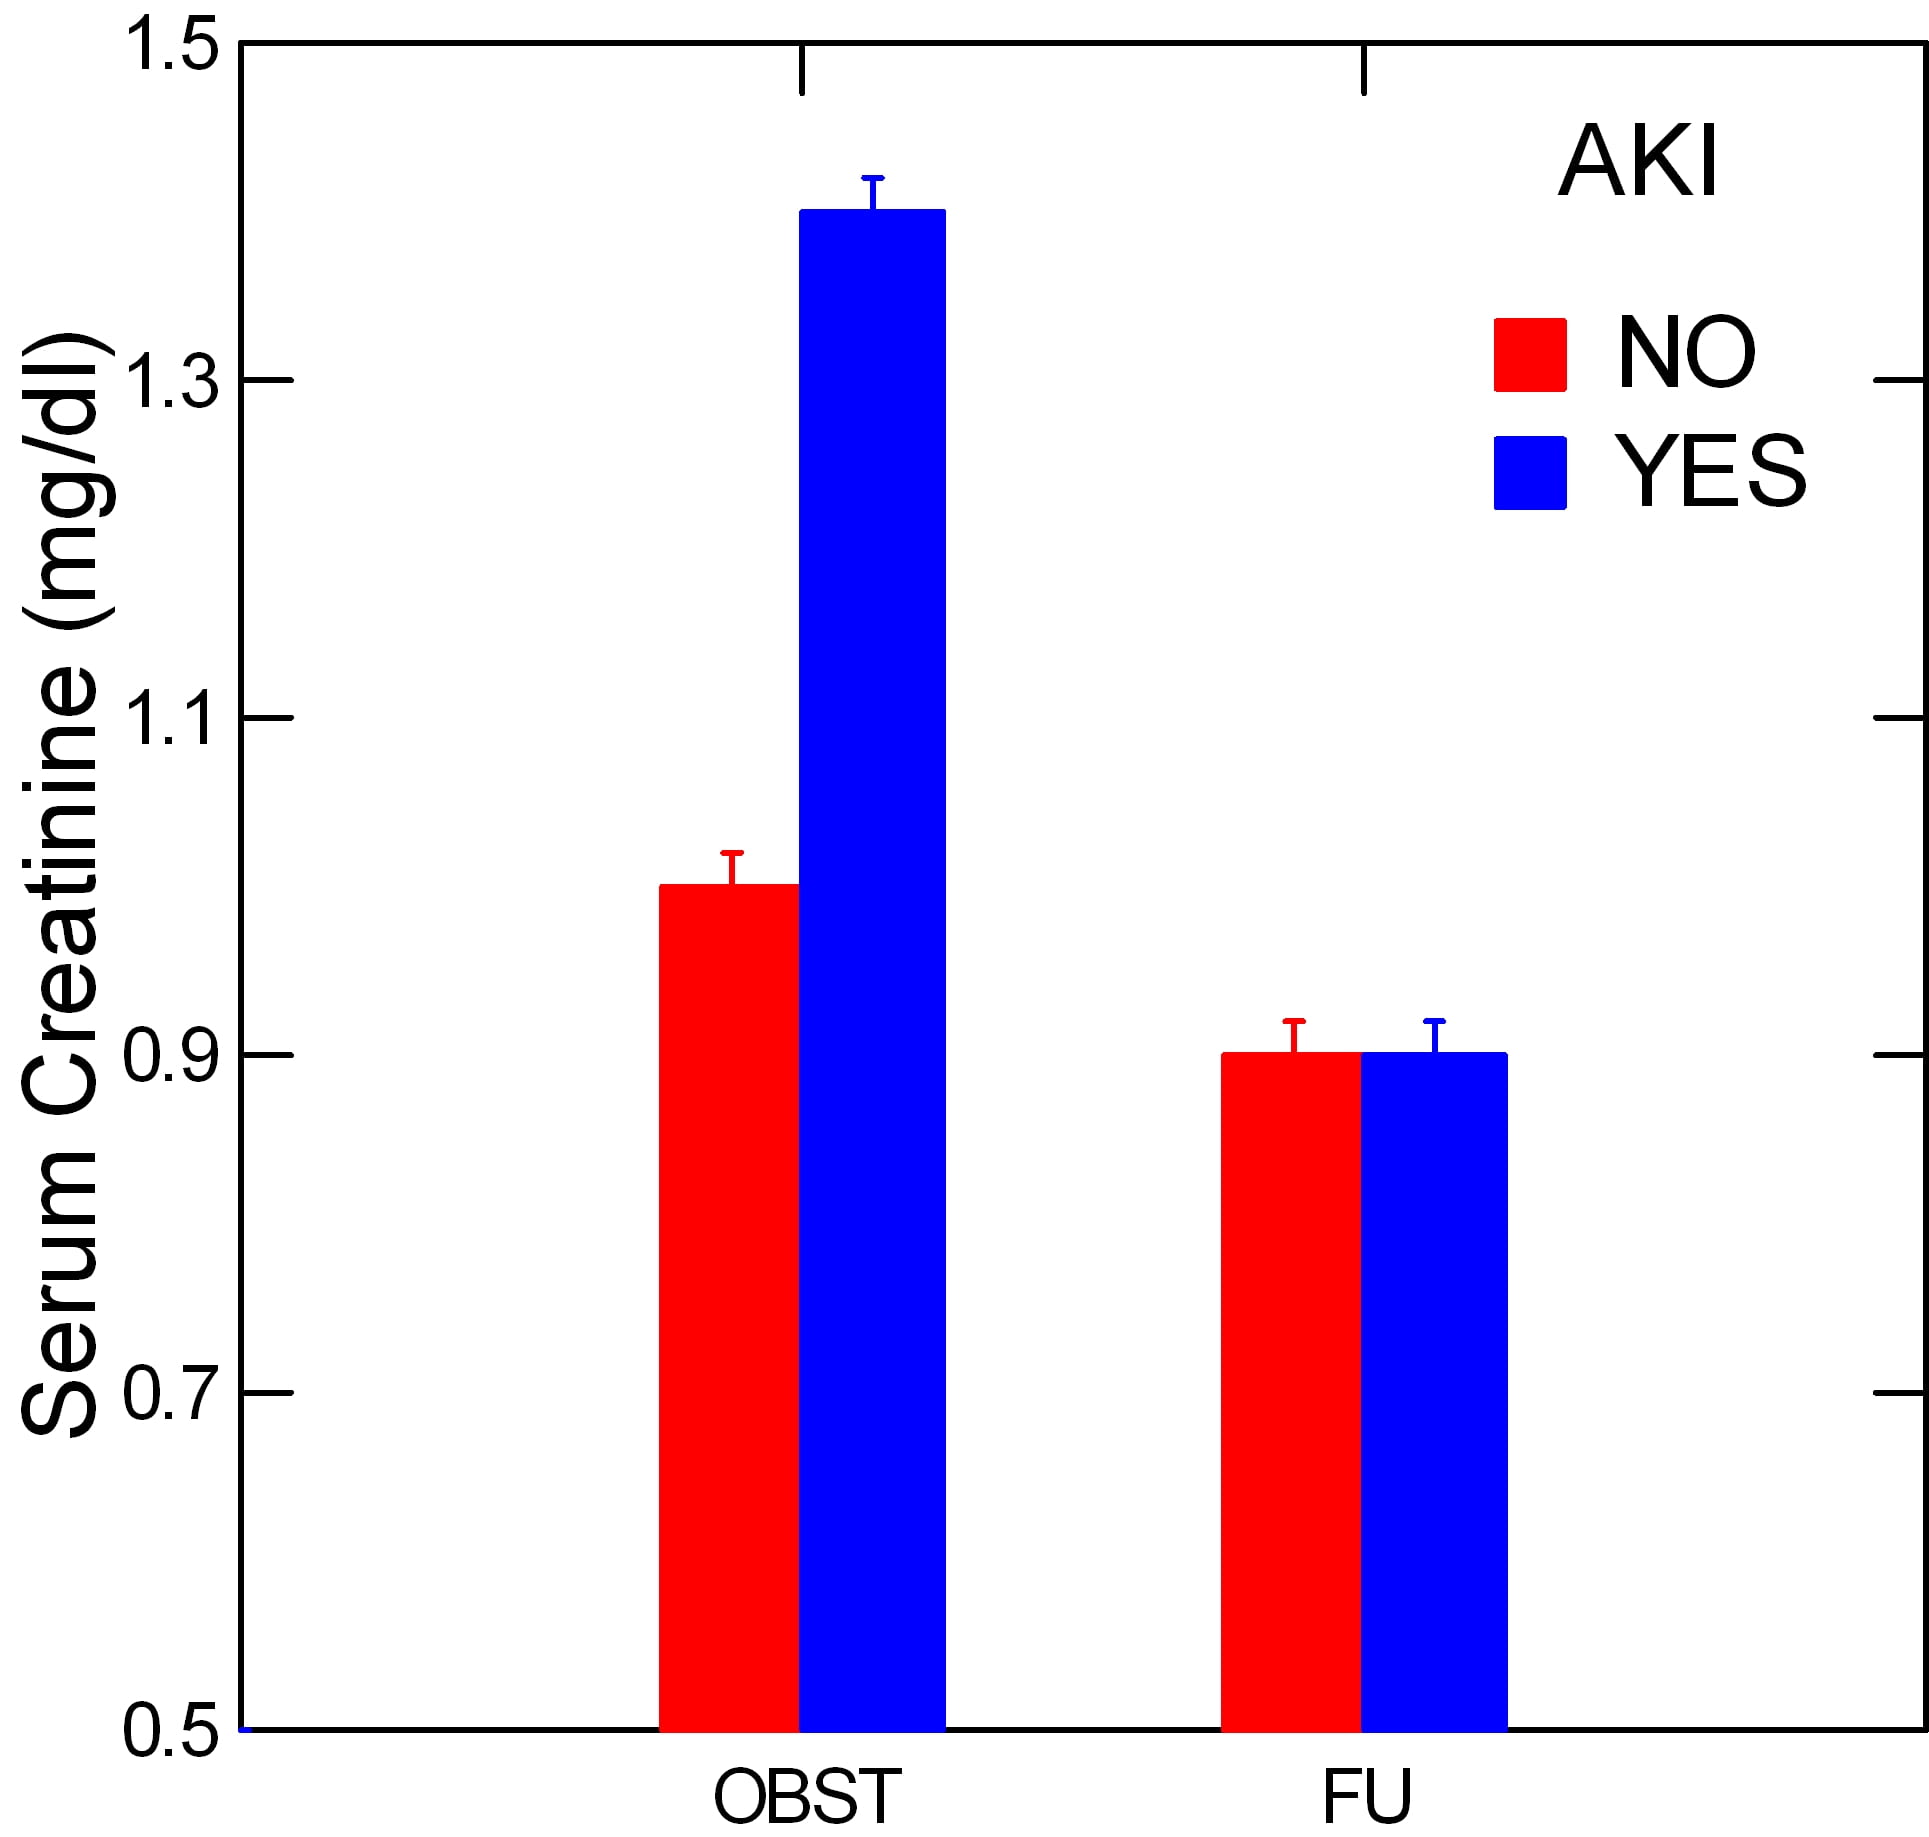 The investigators divided patients into those (27) whose serum creatinine values had risen at least 0.3 mg/dl above baseline as having acute kidney injury (AKI) and the rest who did not meet that criterion.
They did not grade the degree of obstruction.
What Was Found
Acute Reduction of Overall Kidney Function
As expected and shown in the graph, the AKI patients had a significantly higher serum creatinine level before the CT scan compared to those who did not meet the AKI definition. At the follow up measurements both groups had the same mean serum creatinine levels. Of interest, even the non AKI group had a slight elevation of serum creatinine while obstructed (OBST) but the increase was not significant.
Just this set of data makes clear that acute kidney injury may well be present during routine unilateral ureteral stone obstruction. I say ‘may’ because one might offer that vomiting, dehydration, non steroidal pain medications all may have raised serum creatinine despite two otherwise normally functioning kidneys. But their other data make the case that the obstructed kidney was not functioning normally.
Reduced Function of the Obstructed Kidney
During the phase of CT scanning when the contrast agent is entering and moving through the kidney, the density of the contrast essentially measures rates of delivery via blood flow and secretion of contrast from blood into kidney tubules as noted in the prior section.
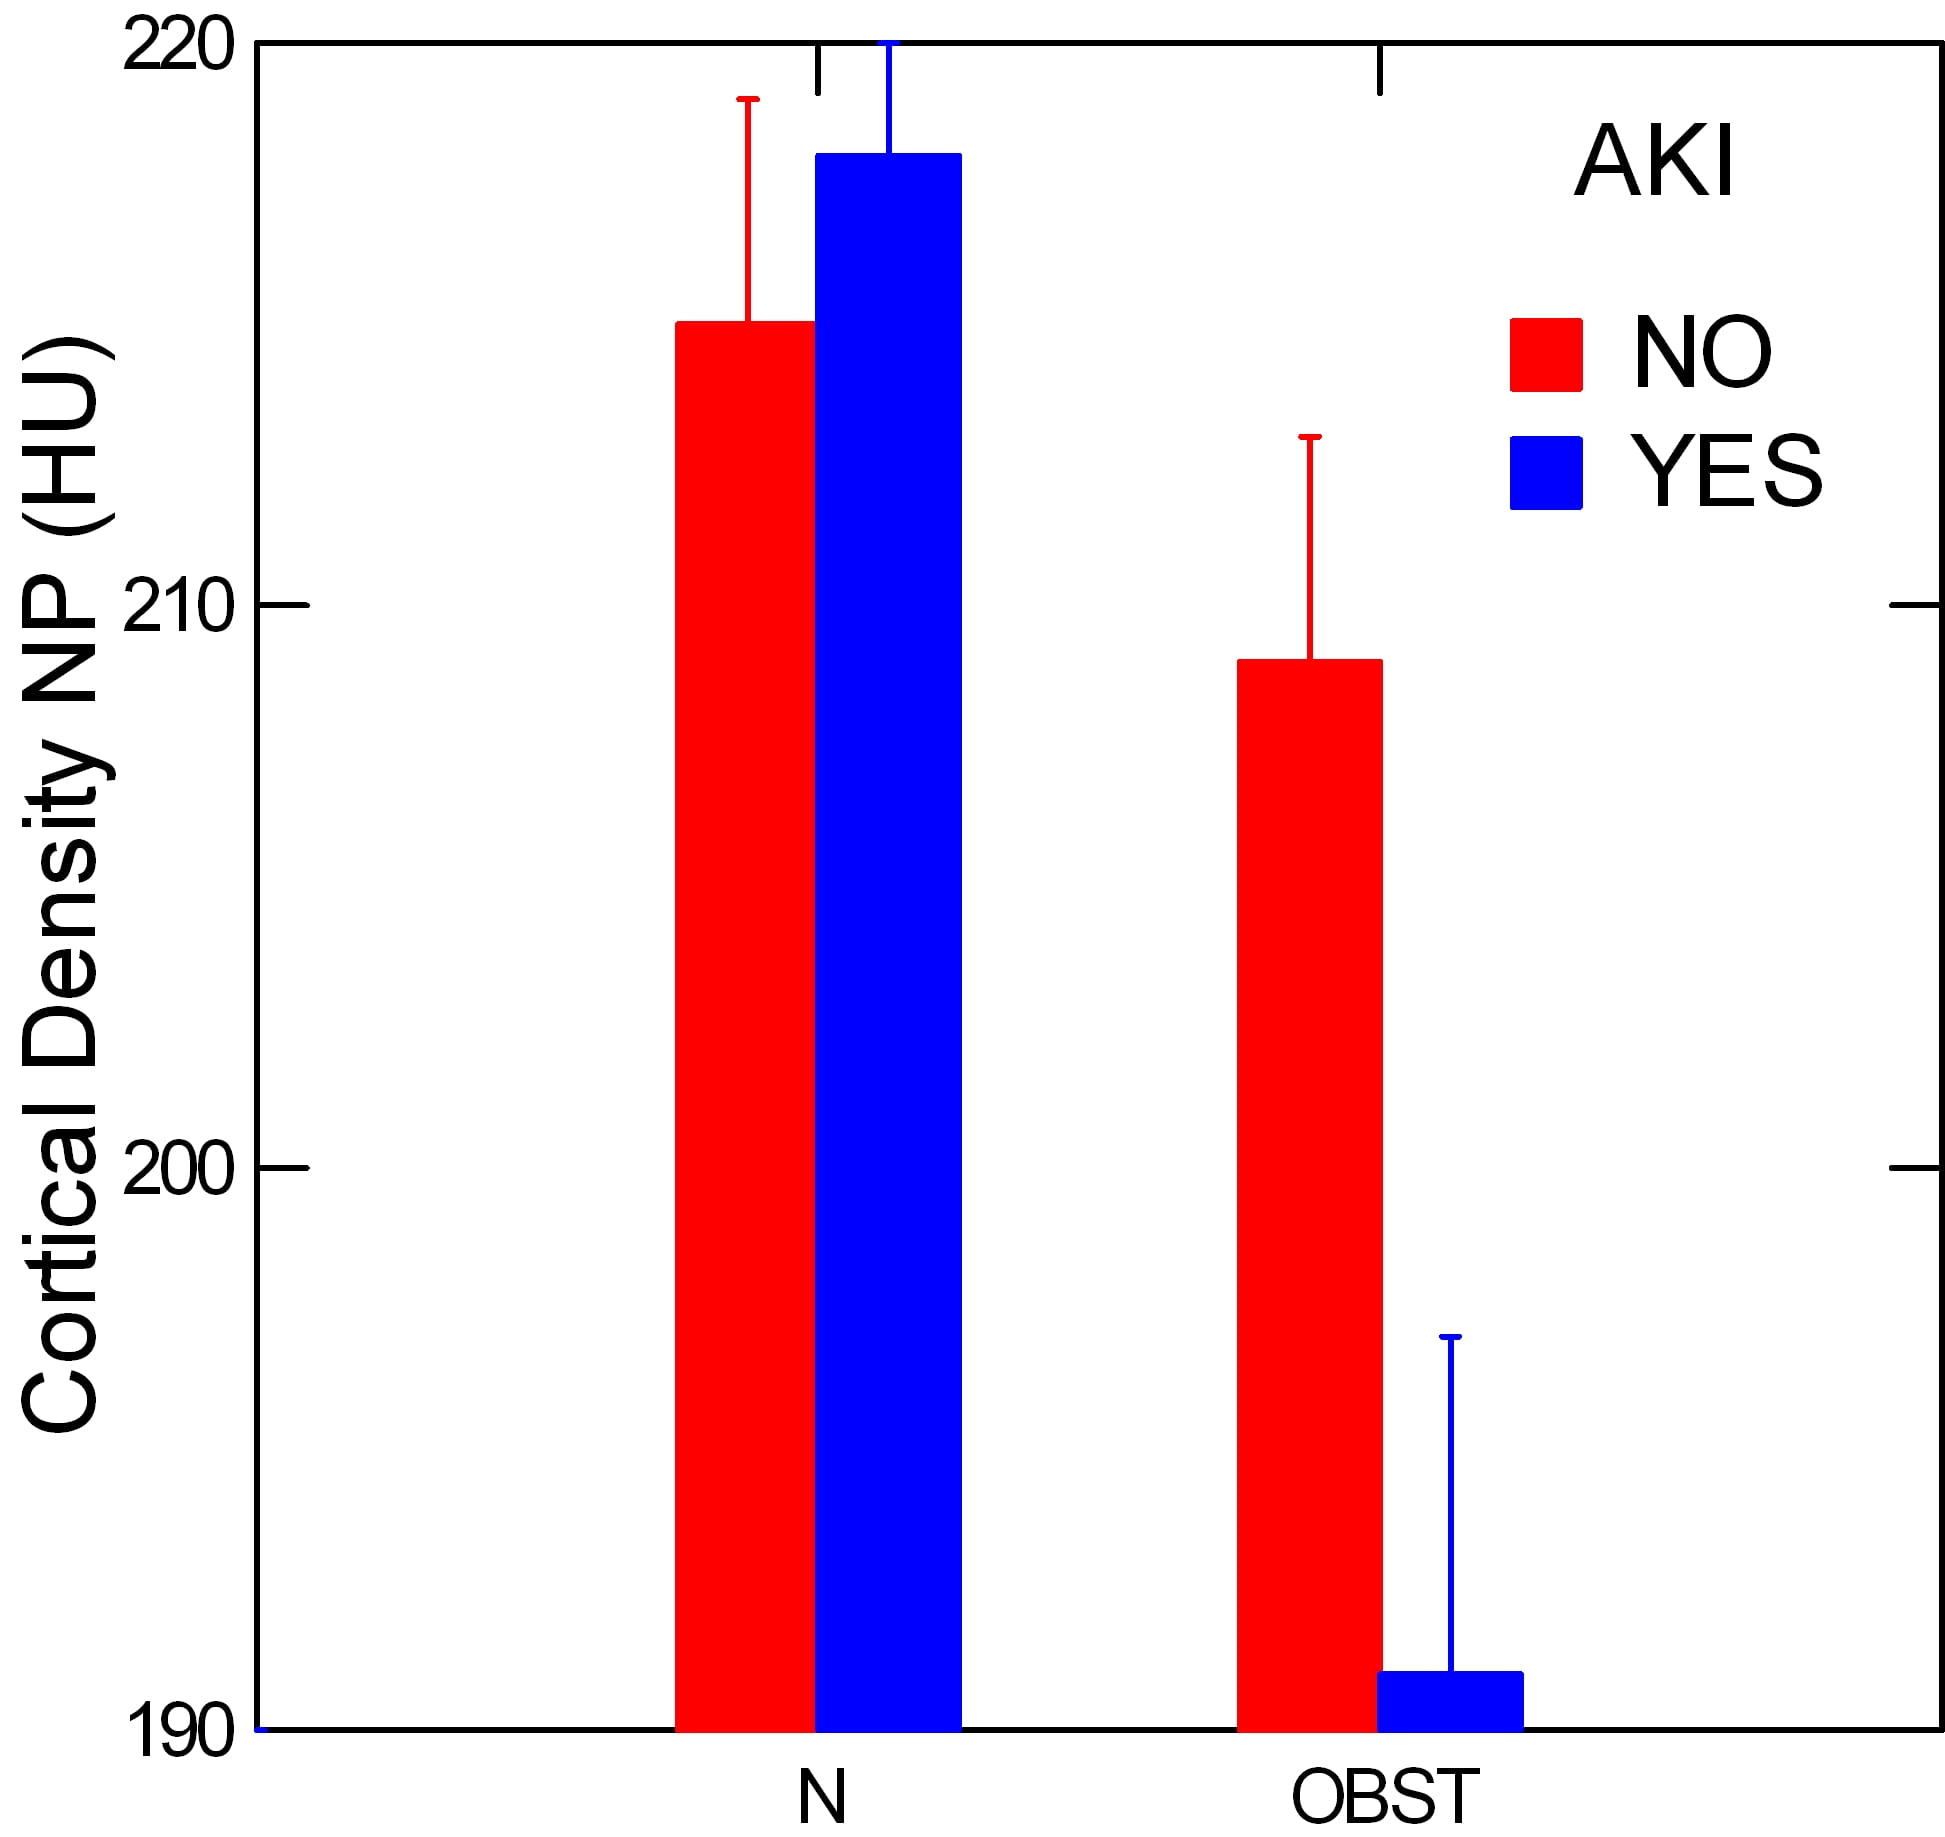
The radiographic density of the kidney cortex at appropriate times during this ‘nephrographic’ phase gauges delivery of contrast, and is much lower on the obstructed side among the AKI patients. This is shown by the lower blue bar in the right hand pain on the graph marked ‘OBST’, meaning the obstructed kidney of the pair.
By contrast, the normal kidney of each patient had the same cortical densities in the AKI as in the non AKI patients – ‘N’ pair of bars.
The authors tried to obtain an index that did not require contrast, as routine stone passage may not require it in all cases. To this end they also measured cortical densities at the same regions but before contrast was injected.
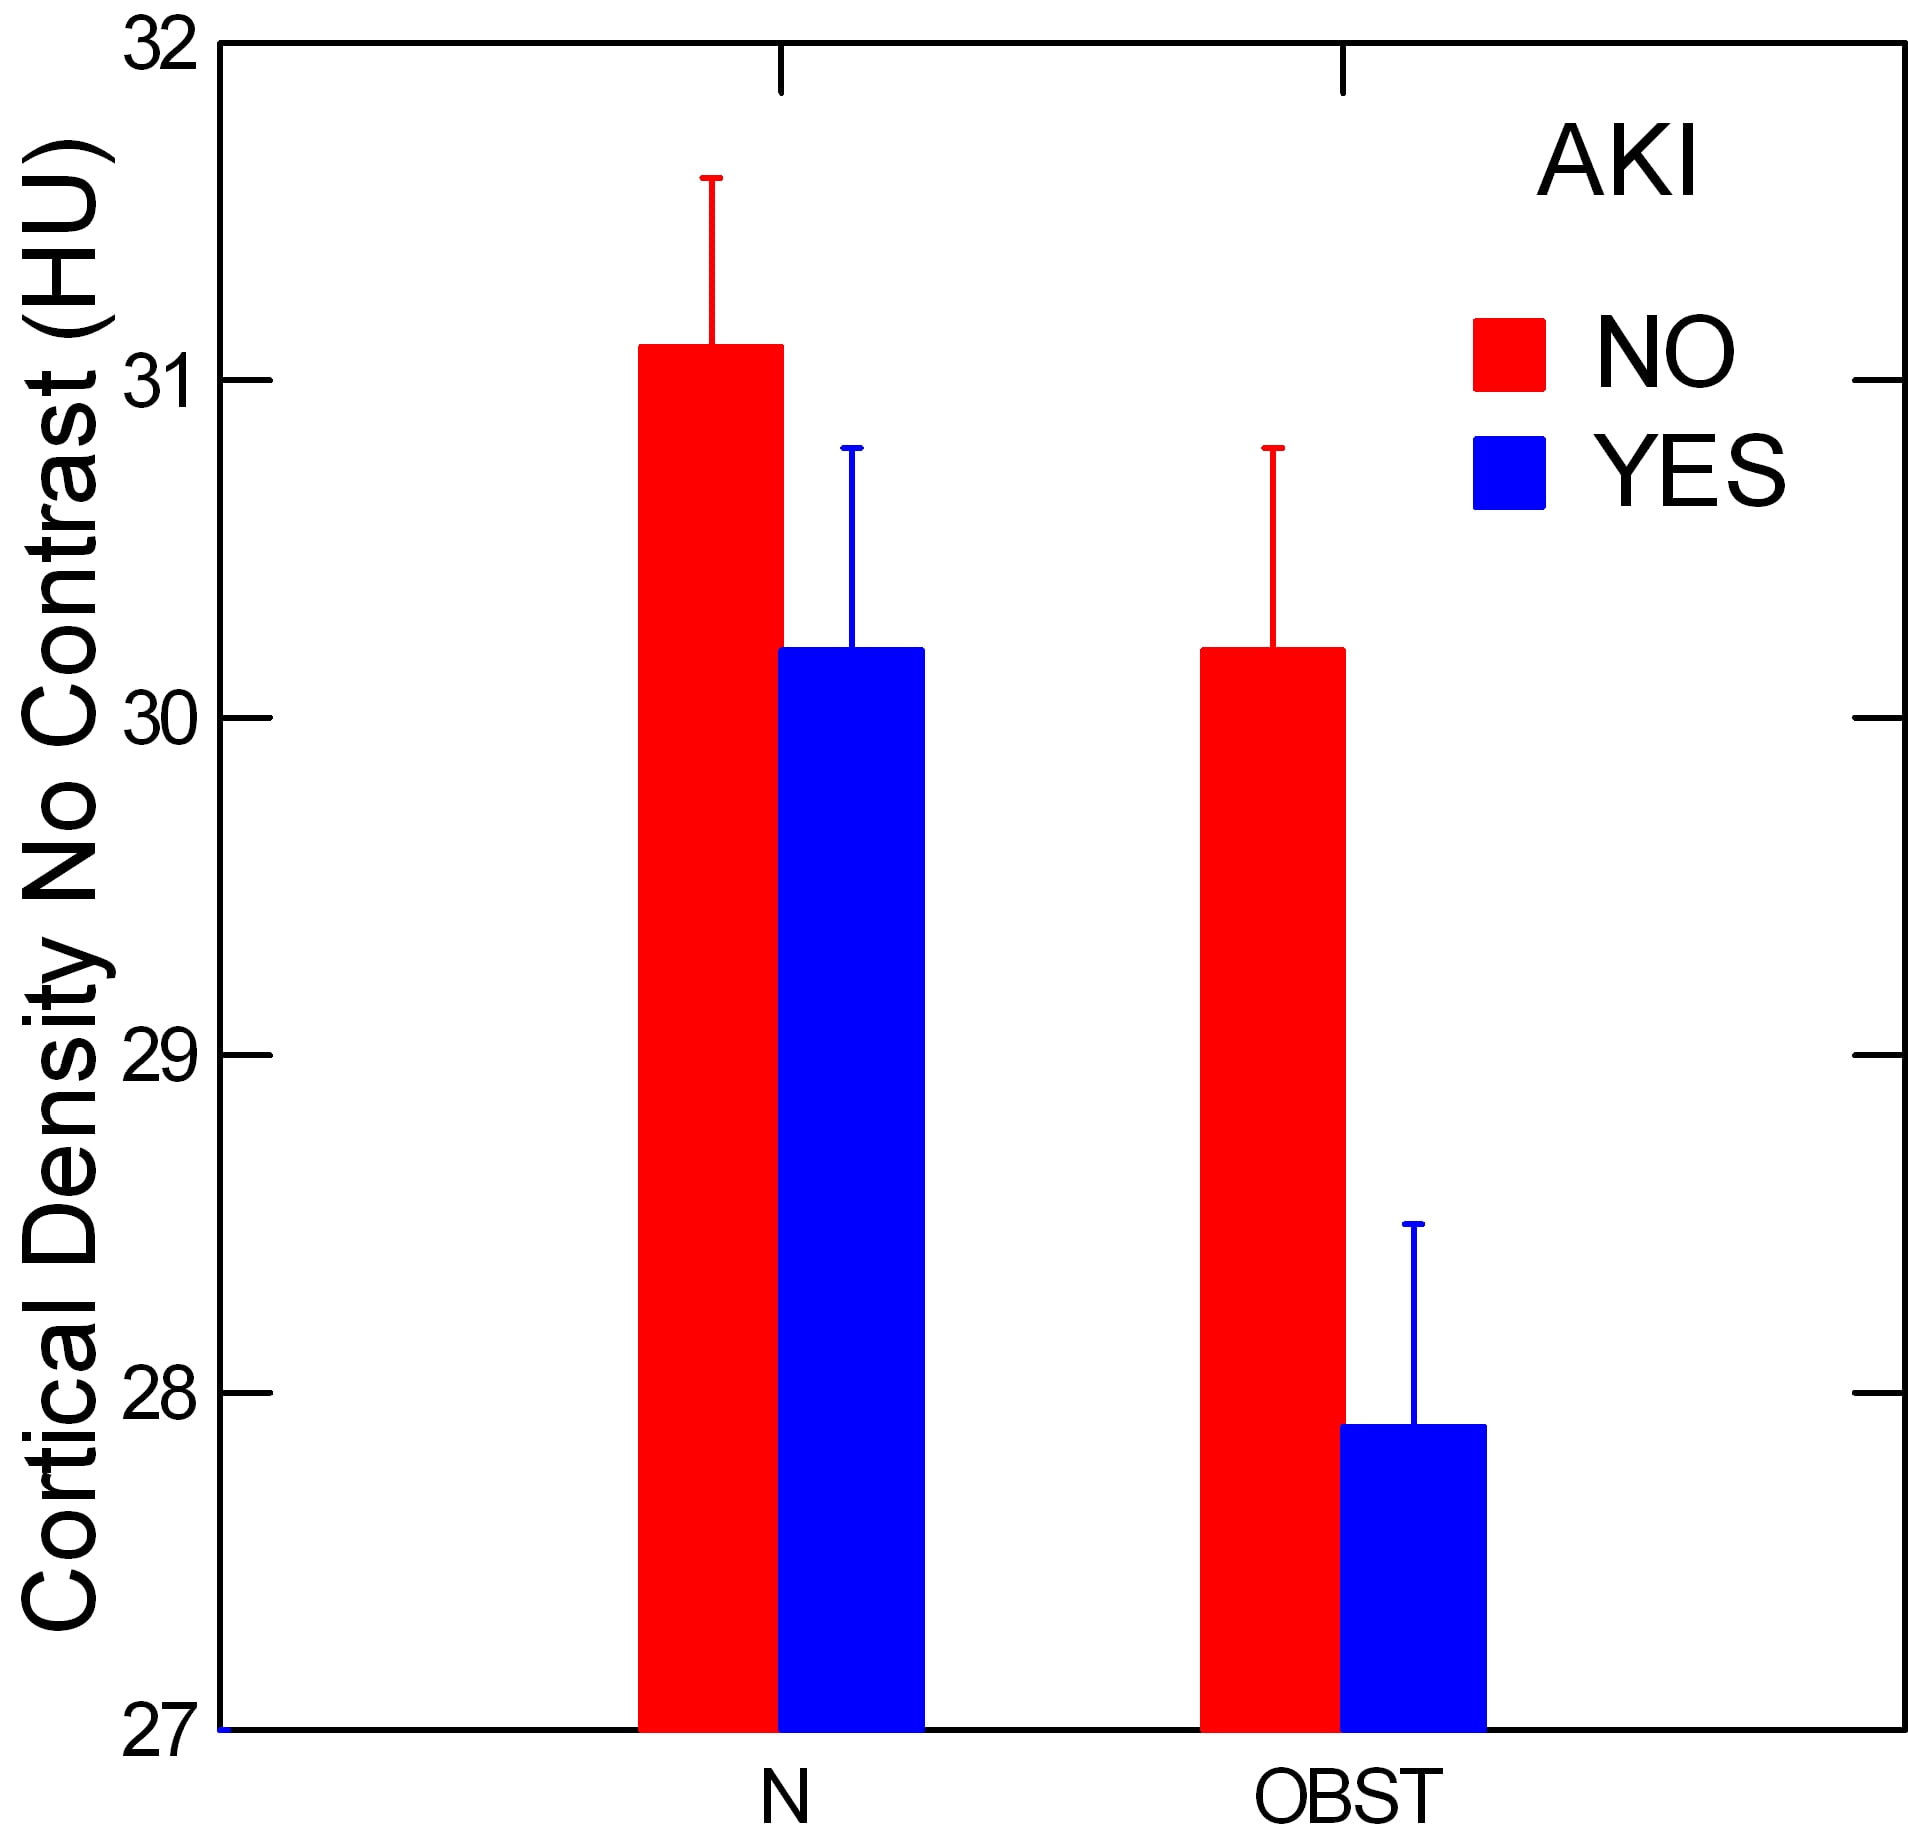 Obviously the HU density is much lower without contrast. But even so the AKI group had a lower cortical density in their obstructed vs. their normal kidneys, p=0.017. This reflects the density of blood filling, for the most part, and is much like the prior study that measured blood flows directly.
Conclusion
The eyes could hurry by this homely and low tech paper, but mine did not.
Systemic AKI was present and, although one cannot be certain, it almost surely reflected the sudden loss of function – partial no doubt – of the obstructed kidney.
The obstructed kidney of each pair took up less contrast from blood and put less into its tissues and tubule fluid – I infer this latter – only among those patients whose serum creatinine rose by 0.3 mg/dl or more, not among those without such systemic evidence of reduced kidney function.
Put these two observations together and I make the case that the loss of function of one kidney can be enough to raise serum creatinine in some cases.
Which cases? I presume those in which the obstructed kidney has serious compromise of blood flow and therefore filtration. This must mean that a rise of serum creatinine of 0.3 or more during unilateral stone obstruction needs be taken as a possible sign of highly significant functional loss of the obstructed kidney. Even though the normal kidney can maintain systemic homeostasis almost perfectly, the obstructed one has possible acute injury of important magnitude.
Obstructed Kidneys Lose Function with Time
Among 76 people whose ureters were unilaterally obstructed incidentally during a surgical procedure, this research group made measurements of kidney function and blood pressure before and after correction of the obstruction. Before the ureter was injured all of the patients had either an intravenous pyelogram of CT scan, so we know none had prior obstruction. Although obstruction was produced by a surgical accident, not a stone, the data are invaluable for estimating function loss from obstruction over time. Likewise, because the obstructions were unilateral, the normal of the pair could be used as a comparator.
Given the ureter was surgically obstructed, the degree of obstruction must have been severe in all cases.
The Measurements Made
They measured the function of the obstructed kidney using an isotope (technetium 99) labeled material (mercaptoacetyltriglycine) that is filtered by the kidneys and also secreted from blood into tubule fluid. Being extracted from blood by both filtration and secretion the material estimates not filtration but renal blood flow itself. The method is well established. Serum creatinine was used to measure function of the two kidneys combined as is common in routine clinical practice.
They measured blood pressure and several interesting molecules related to kidney injury. I will ignore the molecules here, but will show the blood pressure data.
Kidney Function
Although they measured selective function of the obstructed kidney, the authors failed to show that estimate as a function of how long obstruction lasted. Instead they show only the simple estimated
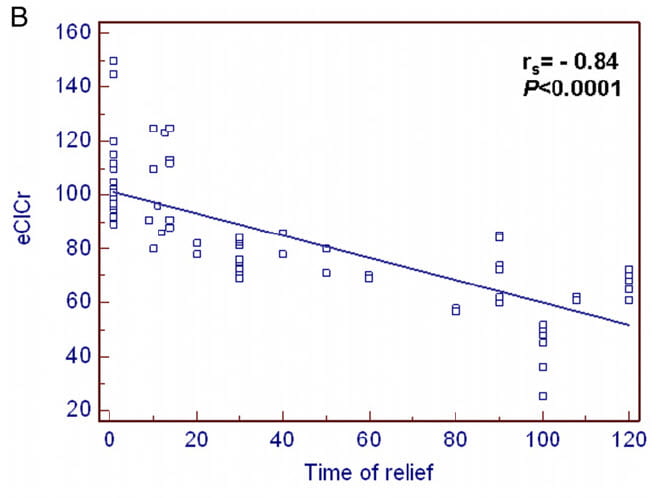
creatinine clearance, eGFR. Here, eGFR is plotted on the vertical axis of the figure vs. time from obstruction to its surgical relief in days (horizontal axis). eGFR, of course, measures function of both kidneys combined.
However mediocre their choice of measurement to display, the data are eye opening. By 20 days or more, this crude estimate based on a serum creatinine shows a decline of overall two kidney function. As time wore on, the overall eGFR continued to fall.
The ultimate eGFR of the those with prolonged obstruction is compatible with near complete loss of function in the affected kidney.
Single Kidney Function
All we have from their single kidney function work is this: If repair of the obstruction was within 2 weeks 26% of kidneys showed a reduction (vs. the normal kidney) whereas if repair was later than 2 weeks 48% showed reduced function (p<0.0001). This means that even 14 days of severe obstruction was enough that a quarter of the kidneys did not return to normal.
Blood Pressure

Blood pressure above 140 mmHg is shown as a percent of patients whose repair was less than (36 cases) or greater than 14 days (40 cases) after the surgical obstruction.
The former group showed no increase of blood pressure in the months after repair, whereas blood pressure of those treated more than 14 days after the obstruction rose significantly.
Those treated later had a higher percent of high pressures before the repair – presumably not significant as not noted – as well as a significant increase in hypertension with a remarkably high ultimate frequency – 87%.
What This Means
We need more such data. The authors point out this is one center, and a modest population. That eGFR would fall from loss of a kidney is not surprising, nor that about 2 weeks appears a critical time beyond which losses of overall two kidney function can be detected with so crude a tool as serum creatinine. It is of interest that by 2 weeks 25% of kidneys no longer recovered to baseline function.
The very high frequency of hypertension, defined by a very liberal high cut-point far above current US norms, suggests this population perhaps already harbored significant renal vascular disease. Possibly a healthier population would be less vulnerable to an acute episode of obstruction.
The authors do not give figures for renal tissue thickness. However as obstruction was complete one suspects the degree of obstruction was severe and tissue loss not uncommon. We have reasons to believe that lost kidney tissue is not replaced.
Kidney Failure From Bilateral Stone Obstruction
When both kidneys are obstructed by stones, kidney failure is evident, and it is not impossible to time the onset, albeit crudely, because illness is prominent. A retrospective study of 53 patients with bilateral obstruction had a reasonable quality and affords another opportunity to assess restoration of lost kidney function after relief of obstruction.
The Measurements Made
The onset of obstruction was marked by flank pain, vomiting, fever, fatigue – presumably from reduced kidney function, urinary bleeding, or edema. The serum creatinine was 5.7 mg/dl on average at the time the obstruction was diagnosed, so kidney failure was very severe. The authors classified outcomes by renal recovery – good, meaning serum creatinine <2 mg/dl, or poor – serum creatinine >2 mg/dl. They chose this dividing point from analysis of outcomes of other kinds of acute kidney injuries.
Using this bicurated classification and analysing each variable separately by ROC curves, they found that duration of less than 25 days was predictive of a good outcome, as was a hemoglobin above 9.85, lack of hypertension, and a thickness of the kidney tissue of >16 mm (lost tissue is obviously a bad thing). Note that 16 mm is a very marked loss of kidney tissue, as normal values are >=2.4 cm.
Using commonplace logistic regression to combine the variables into one model, only duration of obstruction differentiated the ‘good’ from the ‘poor’ outcome patients. The odds ratio for having a good recovery was 21 (2.2 -202 CI), p<0.01 if duration was <25 days as opposed to later.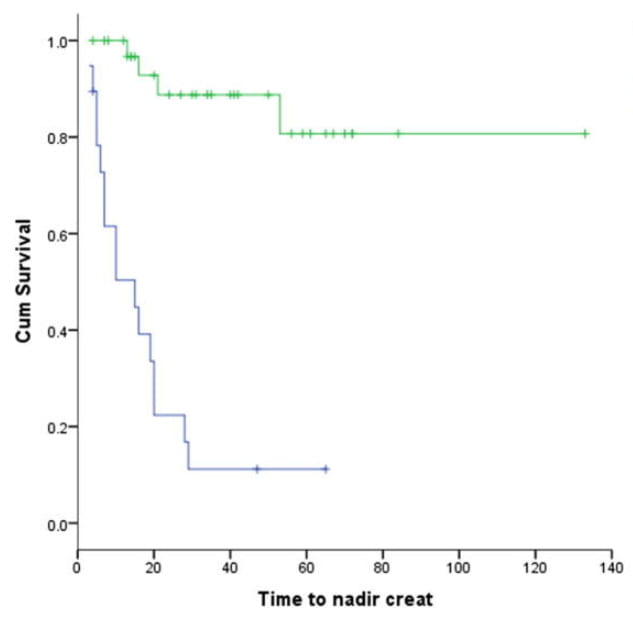
The figure shows the good (blue) and poor (green) groups as survival curves that plot the gradual move of each population to its final lowest serum creatinine level. As all the patients survived, I cannot be sure why the two plateau values differ.
What This Means
Although utterly different in design from the prior paper, the result is similar.
Of all they could measure, only duration counted in predicting between an acceptable and a rather bad outcome. More, the time duration of 25 days is similar to the 14 days of the prior study.
This tolerable agreement despite two different kinds of clinical condition, and despite the obviously less exact timing of obstruction onset here as opposed to the prior study tells me, at least, that about 2 – 3 weeks is a point where intervention seems important.
A small point, but useful, is that the lowest serum creatinine was reached by about day 30 in the good group and day 50 in the one with a poorer outcome.
A larger point is that serum creatinine of 2.5, the threshold for a ‘good’ outcome, denotes severe chronic kidney disease.
No doubt these patients all had moderate to severe obstruction, and they had a significant loss of kidney tissue. The latter is clear since above and below 16 mm of kidney thickness was used to separate the good and bad outcomes. Given that normal thickness is about 2.4 cm, or 24 mm, a majority of cases must have lost a lot of kidney tissue that presumably will not grow back.
Predicting Return of Lost Kidney Function
What about complex situations where kidney damage has already progressed and the obstructed kidney may no longer be viable. Are there ways to predict which kidneys might revive and contribute to overall renal function and those which will not?
What Was Done
A decent prospective study concerned 91 consecutive cases. In each, one kidney was obstructed and the other was judged normal by all usual criteria, and obstruction was relieved so they could ascertain regain of function after obstructive injury. Obstruction was from ureteral stricture in 49 patients, stones in 36 patients, and obstruction at the ureteropelvic junction in the remaining 6 cases.
Using gray scale and doppler ultrasound, and radioisotopic renograms, the authors could measure quite a bit about the obstructed kidneys, including their estimated glomerular filtration and tissue thickness, along with host of details of interest only to physicians and not noted here.
The average tissue thickness was 9 mm with an SD of 5 mm, so these were very damaged kidneys.
What was Found
The GFR, estimated by renogram, and the tissue thickness of the obstructed kidney both predicted the amount, when all variables were considered individually. But when variables were combined in a multivariable regression, only the GFR and blood flow of the obstructed kidney predicted the magnitude of functional recovery after surgical repair. A GFR below 10 ml/min was the best predictor of poor outcomes, with a sensitivity of 90% but a poor specificity of only 66%.
Conclusion
Until clearance has fallen to a remarkably low value, salvage of some kidney function is not impossible and obstruction is worth repair. This is true even when function of the obstructed kidney is very reduced. Tissue mass does not seem predictive. But we know fully well that lost mass will not be replaced.
The End of the Game
One might ask what a kidney looks like when damaged by obstruction. So far as I can tell, it is an organ that progressively loses its working units – its nephrons – and cannot replace them. They are lost, one presumes, from an insufficiency of blood flow that puts the cells at risk of death, and that risk is gradually transmogrified into death of nephrons that can never return.
At the end, the tissue from far advanced obstruction presents 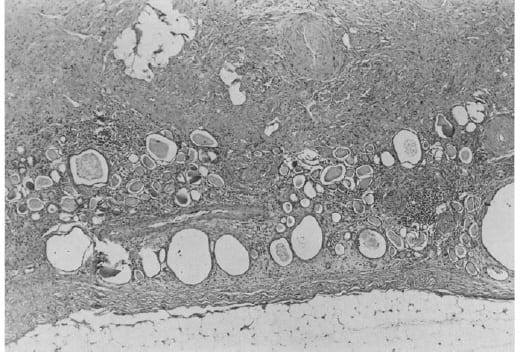 the bleak and barren emptiness nephrons leave behind as they vanish, and are replaced by scar. This kidney was obstructed for many years and not by a stone but by a misplaced surgical ligature long forgotten.
The large rounded or ellipsoid holes are dilated remnant tubules whose lining cells are mostly gone. Glomeruli are hard to find.
Clues from Rats
Although I have emphasized human studies and stayed clear of the rushes and brambles where animal studies lurk, this recent paper is so compelling I could not but include it.
Rats – yes, rats – were obstructed on one side for 3 days, leaving the other kidney normal. Rat experts seem to say that a day of rat obstruction is about 3 human days, so 3 days is about 10 days or so in humans. The scientists harvested kidneys for study at 1, 4 and 18 months after obstruction and compared the obstructed to control sides to allow for age.
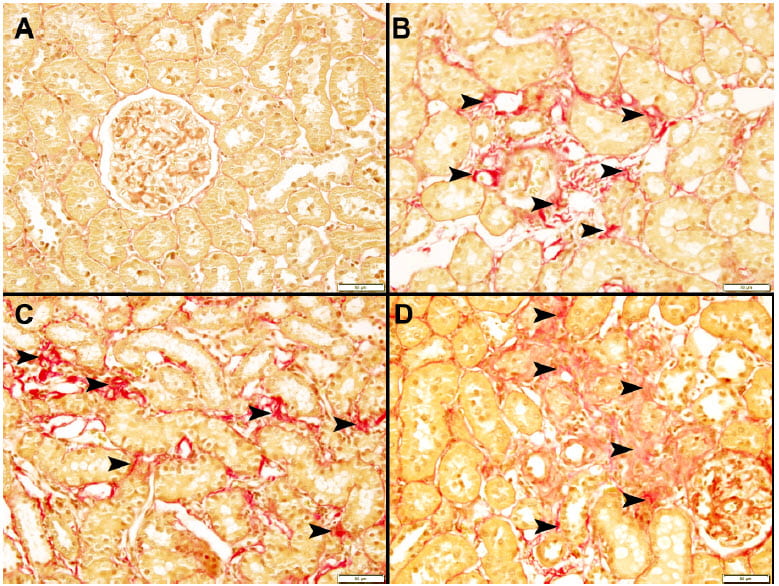
The upper left box shows kidney tissue from the unobstructed side, the other three are from kidneys obstructed for 3 days 18 months before. Arrows point to fibrosis – scarring – not present at all in the untouched kidney.
Routine measurements like filtration rate and renal blood flow had long before returned to normal, and fancy tests of inflammation likewise.
But urine albumin loss, an old fashioned measure of kidney damage was higher 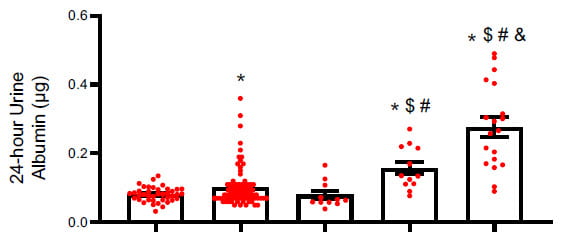
than baseline at 4 and 18 months, consistent with loss of kidney cell function from progressive scaring.The bars are baseline, 1 day, one month, 4 months and 18 months after 3 days of obstruction. By 4 and more at 18 months kidneys were losing excess albumin.
I do not much believe in rats as measures of human disease propensity but this was very well done and the time correspondence haunts my mind. About 2 weeks in humans, 3 days in rats, engenders kidney scaring.
Does this mean we need to operate at 2 weeks? Of course not. But, I would not be perfectly sanguine at 6 weeks. Too much suggests shorter obstruction is better.
How Long Can we Wait?
From What We Have Now
We need more data.
From what we have of timed obstruction, 2 – 3 weeks seem the outer acceptable limit for correction of moderate or severe obstruction. Of these I vote for 2 weeks, because in the ureteral ligation study single kidney recovery to baseline did not occur in 25% of patients even below 2 weeks, and after 2 weeks nearly half failed to fully recover.
Of course the two studies involve severe obstruction whereas many passing stones cause only mild obstruction. Furthermore, patients in the first study had what would appear to be underlying hypertensive vascular disease, and those in the second study had overt and very serious kidney damage. Mild obstruction in an otherwise healthy young person may have altogether different effects.
Even so, pending more data, 2 weeks seem not unreasonable for even mild obstruction.
More, we should perhaps be careful to compare obstructed to normal side renal mass on CT scans or ultrasound studies, and cast a cold eye on any evidence of reduced mass. If present at the outset, that kidney has less reserve. If, in the worst case, mass is lost during an obstructing episode, time is up and intervention must occur.
As well, we can keep an eye on serum creatinine. From the one study we have, it rises by 0.3 mg/dl in some patients, not in others, and in those with the rise the obstructed kidney may be more compromised than in patients whose serum creatinine is stable.
I recognize that surgery always carries risk, and that many small stones can cause significant obstruction, even into the moderate range, yet have a good chance of passing on their own. For this reason no one can be too certain given the data we have. But – that word! – perhaps caution is important by 2 weeks if obstruction is moderate or severe, or if there is evidence of systemic vascular disease or even slight preexistent renal disease.
Current Guidelines
The American Urological Association has diligently updated and promulgated detailed guidelines to help surgeons care for their patients. About the timing of surgery they offer this: “In most patients, if observation with or without MET is not successful after four to six weeks and/or the patient/clinician decide to intervene sooner based on a shared decision making approach, clinicians should offer definitive stone treatment. (Index Patients 1-3) Moderate Recommendation; Evidence Level Grade C”. (MET is medical surgical expulsion therapy)
Let me be clear. The authors of this guideline are a brilliant and thoughtful group. I know them and respect them greatly. They know about the papers I show here, and others, too, that I have not shown.
Perhaps I have a different viewpoint, being a nephrologist and not a surgeon. They have a greater sensitivity to the surgical risk they must balance against risk to kidney tissue, I to the tissue, being no surgeon at all.
That they and I can come to rather different equilibrium points about so important an issue means only one thing: we lack sufficient human data, and we need to get it.
What we Need
Of course, the correct answer is more studies of humans with real stones obstructing their kidneys. Animals will not do. Species differ.
We need more and better urological research on kidney damage, tissue loss, and functional outcomes from stone obstruction taken over time and grouped by degree of obstruction. Single kidney function is needed, not just serum creatinine. Followup times need be long enough so we know the final kidney outcomes.
Science ultimately works, but we will not have better answers here until some scientists provide more data on this crucial clinical question. These scientists will per force be urologists, for only they can conduct such studies.
Other Issues
Silent Obstruction Destroys Kidneys
Obstruction can be silent, or almost so, and destroy a kidney in months.
Because of the dangers silent obstruction poses patients need be wary.
Stone formers know stone pain, so any hint of such that is not explained – disappears with stone passage – deserves an ultrasound. Suspicion warrants consultation. The cost of an extra image is nothing compared to a missed obstruction. An excellent research paper makes this point in numeric terms concerning postoperative imaging to exclude missed obstruction after ureteroscopy.
Silent obstruction is not rare and usually not so silent as it is subtle and easy to put away in a corner. I suggest the opposite. Some wasted imaging means nothing compared to kidney loss.
Screening For Systemic Causes of Stones Matters
Because stones from bowel disease, renal tubular acidosis, cystinuria, primary hyperparathyroidism and the like associate with lower long term kidney function they deserve special attention. This begins with recognition preferably at the first stone attack. My site has always emphasized the critical need for such diagnostic screening, which only physicians can implement. Once detected systemic causes require special physician attention and, unlike for the very common idiopathic stones, patients can do less for themselves with respect to fluids and diet. More important here, these kidneys seem far more vulnerable to damage, so an episode of moderate or severe obstruction is best abridged as soon as possible.
Stone Formers as Kidney Donors
I have not searched for nor presented data here on this topic, so withhold opinion. But – even so – the remaining kidney can be prey to obstructive episodes and the patient to bouts of severe kidney failure. At the very least, stone prevention is crucial. If stones have been an active problem – not simply an incidental single stone found during transplant donor evaluation donation is not an immediately attractive idea, to me.
Stone Prevention is Wise
Quite apart from miseries of pain and surgery, infection, bleeding, and all that attend on stones, prevention may protect kidney function. No trials support this idea nor can one imagine a trial mounted to ask it anymore. But if one turns an objective and clear eye on stone obstruction it has all the makings of a culprit, a destructive one at that. It is a little like a small fire in the house, or a thief.
Why not put it out?
And keep it out?
I wish to thank Dr Luke Reynolds for reading the final draft of this article and offering important suggestions that have been incorporated.
I also wish to thank Dr John Asplin for a careful reading of this article as in so many others over the years. He found a missing reference, and it was that which led me include a paper I had overlooked. His suggestions have been incorporated.
I’m really surprised that you would include this article by “MIke Borofsky” about the horrors of stone pain. You are doing NO ONE any good by encouraging panic and fear in those who deal with kidney stones. NONE at all! Talk about sounding like it is the end of the world! As a fellow stone sufferer and someone who knows my fair share of others who have had a variety of experiences with stones, this is probably the worst thing for anyone to read that has to deal with this issue. Perspective people! Dr. Coe – there ARE worse pains in this world than kidney stones. STOP scaring the crap out of people! You aren’t helping anyone. Doubt you will publish this – but I urge you to THINK before you post this stuff!
I greatly appreciate this article. My 28 year old daughter lost a kidney and my husband is in the hospital now with 4 cm and 9mm blocking both kidneys ,talk about silent. It really helps to understand what our loved ones are going through . So, to you, I say thank you.
Hi Jennifer, Be sure both get fully evaluated for cause of stones. Here is a good article on the subject. Regards, Fred Coe
I am 45 n obese
i have several small stones on left side and a 1.8 cm one thats obstructing on my right side.Urgent care found them 4 weeks ago i have been in tremendous pain off n on i finally go to a urologist in cape mo friday any ideals how they will remove it?my liver is overlapping my bladder do u think they will have to do a pcnl and me have a nephro tube because of myvweight or maybe a easier way n no tube like maybe a stent
Hi Christy, If possible ureteroscopy would be ideal as it is independent of body weight. I suspect the stones are uric acid, which means small ones can dissolve and new ones be prevented by taking alkali. Be sure the stones are analysed. I suspect a PERC will not be the first alternative but of course I am far away and do not know the details. Regards, Fred Coe
Well done website! I have learned a lot from this site. Thank you. I have a problem and would like your insight. I am living in a Red Zone/ Covid-19 area. On 3/2/2020 I was in the ER with Multiple hours of intractable pain to then get a CT scan which showed a 2 mm stone at the right ureter bladder junction. I have suffered with consistent flank pain level 3-9 of 1-10 scale. Also actual spotting and bloody urine occasionally ever since. I have been intaking 3 liters a day with adequate output. Bun /Creat are WNL. Today Ct Scan with contrast shows only the left ureter highlighted with dye. How aggressive should I be with this doctor office on a holiday weekend in a COVID red zone? Constant pain managed with over the counter meds. Should I grab my medical information and drive to a non-covid location in the green open phase for preventative care.
Hi L, You have a problem indeed. The stone on the right may well be blocking drainage from that kidney. A contrast study appears to show only the left side so function on the right may be reduced significantly. If this is true, it may be best to get the right stone out – it is at the bladder/ureter junction, so not hard to get. However Covid dictates my concern would be prompt evaluation for a need for removal. The stone was first observed in March – kidney damage is possible if it is indeed obstructing. Regards, Fred Coe
Good Afternoon,
First time visiting this site. The information has been great. As part of a routine Chest CT scan, a single stone of 10mm was detected in my left kidney and was confirmed by an ultrasound too. I have no symptoms at the moment, and the blood tests were normal according to my GP .
I live in Miami and was wondering if you have a recommendation for a urologist locally that I can consult with.
Regards
Hi Angelo, Reviewing the urologists at the university of Florida, Miami, I saw this physician who has had superb training in stone urology. I would advise him as your choice. Regards, Fred Coe
Excellent
Thank you! Fred
Hello. Thank tou for the information. I am concerned about my situation and I would like an opinion. My first bad, kidney pain episode was on May/29. But about 1 month before I had a little of back pain. Then, I had another bad episode on 06/21. Went to ER, CT revealed a 5mm stone close to the bladder junction. Left home to pass. A week later went to ER again on 06/29 with horrible pain. Saw urologist next day. X rays shows no stone. Since then I have a lot of urgency and burning but no bad episode again. I’m filtering my urine every day throughout this process. I saw no stone pass. Also I’m having white mucus come out when I pee. On 07/01 my kidney function looked good. My urologist is choosing a wait and see approach until next week on July 13 to do an ultrasound. I did an ultrasound on June before the CT and no stone was shown. Should I be concerned about this waiting? She offered to do laser surgery but after the x-ray she is adopting a waiting game. Should I be concerned about my kidney for waiting this much? Should I do something now and not wait?
Hi Caroline, A stone at the junction of the ureter and bladder can obstruct your kidney but I imagine your urologist is taking all precautions against this. The CT could have revealed obstruction, and so can an ultrasound. I cannot offer a medical opinion in particular as I do not know the results of any of your tests but can say that your surgeon is totally responsible for protecting your kidney and you, and I suspect she is doing that as best she can. Regards, Fred Coe
Frequent stone former here (urologist says possible MSK). What you describe is similar to my latest episode last month where I had the terrible pain and then the urinary burning and frequency. I thought I possibly had a UTI and took a course of Macrobid but the frequency would not stop. Was going to bring it up at my upcoming doctor appt. Decided to load up on extra fluids and urinate as forcefully as I could and lo and behold the stone passed (6 mm). A couple hours later, the frequency was completely gone and never came back. My theory is the stone was irritating the internal urethral sphincter and making me feel like I constantly had to go. Does this sound feasible, Dr. Coe?
Hi Corey, It does indeed. Here is another version of the stone pain character. You did the right thing. Fred
Dr Coe,
i have a 7 to 8 mm stone in my left kidney and although it has not bothered me, it was found on ct scan in December while looking at something else. The urologist recommends Lithotripsy. Is it possible to take alpha blockers or calcium channel blockers when/if the stone decides to move. It is not obstructing, I have no bacteria and no hydronephrosis. I will admit I am nervous having it there and am starting to lean towards just having the lithotripsy and hoping that will do it so that I can move forward. I have started having better habits that includes drinking about 3 liters of water a day, fruits and veggies, no added salt while also watching my salt content, watching my sugar and making sure I am getting my calcium and vitamin c through diet and not supplements. Last but not least I am taking potassium citrate (NOW brand) Pure powder mixed in with my water throughout the day to keep my ph neutral. I have really only had one other stone in my life so I am really optimistic with these positive changes to my diet and lifestyle that I can prevent another stone in the future. I am also thinking about getting my parathyroids checked. By the way I am a 54 year old healthy female of normal weight with no co–morbidities but I realized that I did not drink enough water. I welcome any input you can give me.
Patty
Hi Patricia, it is a large stone, and perhaps better gone. Shock wave lithotripsy is not unreasonable, but I would ask your urologist what are the likelihoods of getting a stone free kidney vs. ureteroscopy – which should insure that. I would not make major life style and diet changes – apart from attention to fluids – because you do not know what the stone is made of, or what has caused it. Take a look at a basic review of an approach to stone prevention. As for primary hyperparathyroidism, which could be a cause given your age, the main issue is fasting morning serum calcium – high or not. Regards, Fred Coe
Dr Coe,
I did do two 24 hour urine tests AFTER I did lithotripsy and by the way lithotripsy did absolutely nothing in regard to the stone. My analysis showed i had alot of calcium in my urine and I also did a bone density test that I have osteopenia, my nephrololgist did not seem to be concerned with that he stated my saturation levels were good. My urine calcium was 336 the first test and 300 the second. I did have a consult with Jill Harris and I am considering setting up a televisit with you. I had both my test thru Quest but I am thinking of having it done next time with Litholink. My nephrologist does cannot justify putting me on Thiazides to lower my urine calcium. I still have the stone and the third urologist told me he would do nothing right now to remove it if it is not bothering me, so basically I am at a standstill, I can find a fourth doctor who will do the ureteroscopy but am I am not thrilled about doing that on a asymptomatic non obstructive stone. And quite frankly I am very frightened of having to get a stent. Can you advise me?
Hi Patricia, You have obvious high urine calcium and bone mineral loss, presumably idiopathic (genetic) hypercalciuria. As in my last note to you, primary hyperparathyroidism is also not unreasonable so you need to be sure that multiple fasting morning serum calcium levels are normal (<10 mg/dl). I am happy to advise you which as you say would require a televisit as it is practicing medicine. My secretary is at 773 702 1475. Regards, Fred Coe
Thank you Dr Coe i will call to set up a televisit
Dear Dr. Coe,
Thank you very much for your book. Because of your writings, I have been able to channel my worries after a kidney stone diagnosis into learning about my health and, hopefully, working towards improving it in the future. Not only that but you have been able to show me a glimpse of the beauty of medical research.
After an episode of gross hematuria, a CT revealed a 5 mm non-obstructing radiopaque stone in the lower pole of my left kidney. No hydronephrosis. Initially, it was not bothersome at all. But lately, I do have some mild pain. My GP informed me that there is a considerable chance that I might pass the stone, prescribed me tamusolin, and asked me to schedule another appointment in a month – everything according to the guidelines. However, after a couple of weeks, it seems that the stone has not progressed. In addition, given the size of the stone, I am concerned about the obstruction that it could cause if a colic were to happen.
Reading your articles and the published literature, it seems likely that the best path of action will be to undergo ureteroscopy. I have never been on the operating table and it terrifies me. But even more than that, navigating the medical system seems a daunting task. I live in the Chicago area and I have looked for urologists but most of them seem to specialize in areas other than lithiasis (e.g. prostate cancer, fertility, BPH, etc.). In searching for an ideal urologist to perform a ureteroscopy for kidney stone removal, what characteristics or training should I look for?
Thank you,
Daniel
Hi Daniel, I gather the stone is in the kidney and not passing through the ureter. That – if true – makes removal or not elective. Strictly speaking, the chance of a stone in the kidney passing into the ureter is – in a single person – not predictable. I will write to you at your email with suggestions concerning prevention and potential surgery. Regards, Fred Coe
Hi Dr. Coe,
I appreciate all your guidance and facts provided. I have a none obstructive left distal ureter stone measuring 6 mm wide, density greater than 1100. Two months passed and stone failed to enter bladder. I am alternating Tylenol and Advil but concerned of long term risk while on the medications including Tamsulosin, while drinking over 1 gallon water. I am somewhat tolerant to the the discomfort and hoping it will pass but should I continue to wait? I am trying to avoid Ureteroscopy of laser lithotripsy.
thank you much
Hi Sid, I gather you have a non obstructing left ureteral stone causing a lot of pain. Frankly, I wonder if it is time to remove it. Are your physicians sure drainage is normal? I presume your serum creatinine level (estimates kidney function) is not above your prior baseline. I am not a surgeon so I never get too involved with timing decisions even for my own patients – surgeons do this. But I did write the article based on almost all the human data available. Regards, Fred Coe
Hi Dr. Coe,
I passed the stone Saturday night (70 days), what an experience. The first four days was very painful with renal colic. A month prior I had full blood work and urine sample, baseline numbers were excellent, except micro hematuria, Urologist said “5% chance of cancer”. The stone was very sharp and hard. I am assuming micro blood was from the sharp stone traveling tearing my ureter. Urine flow stopped as stone exited bladder and entered urethra, one hard push sweet sound of “clunk”. I do have slight discomfort in lower ureter “UVJ area”. I guess this is normal since it is the narrowest part. The Urology clinic has sent the stone to lab for evaluation. Once I get results, I will re-read your personalized diet and water consumption article.
Thank you very much for all your time and details in each article.
Hi Sid, I am happy it passed. You really should be evaluated. Here is my best on it. Regards, Fred Coe
Hi Dr. Coe,
the lab results of stone type, is Ca oxalate Monohyd 41%, Ca oxalate dehydrate 49%, UR Hydroxyapatite 10%. Based on your above reading I was dehydrated? The Urologist says he does not need to see me for another year lol.
Hi Sid, You said you had 24 hour urine testing. You should look yourself and see what is abnormal and causing stones. A year is a long time without and diagnosis or prevention. The article I linked for you gives lots of ideas about how to look at your labs. The site has articles on the stone labs, as well. Regards, Fred Coe