Although seemingly devoid of biological importance in humans, oxalate traces a curiously elaborated path in and out of the body. Incidentally, and from time to time, it contributes to calcium oxalate stones, and in extreme instances, to kidney damage and even kidney failure.
You have two choices. You can read the article OR you can watch this brief movie which says what is in the article by way of an introduction.
The Main Factors
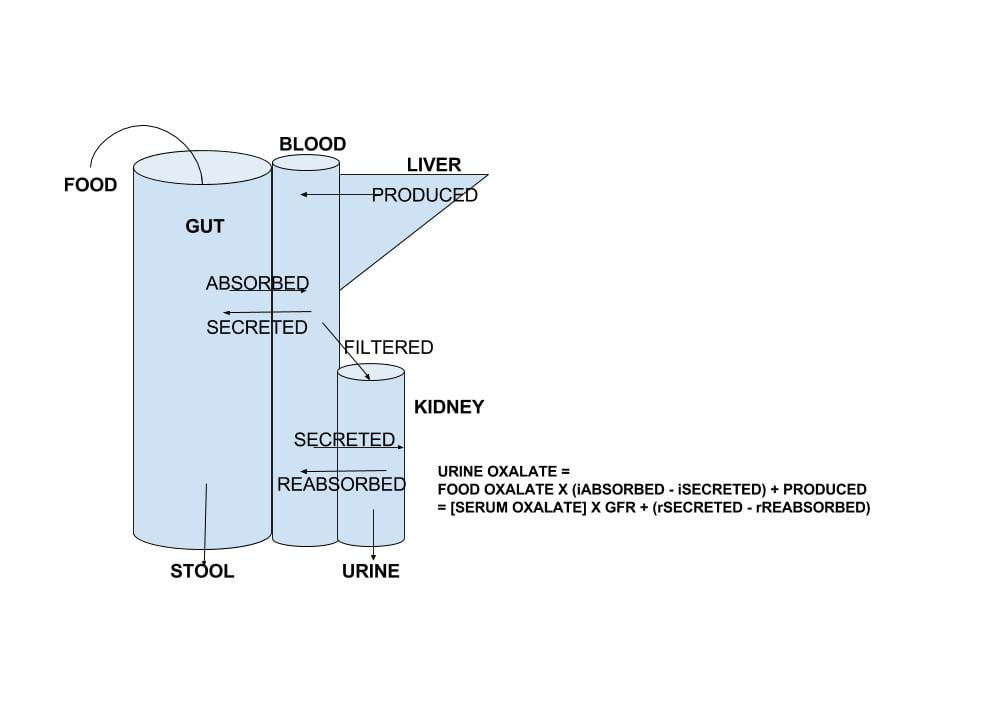
The large drawing that heads this article summarizes oxalate movements through the body.
What enters the blood is the sum of oxalate produced by the liver plus the amount absorbed from foods, minus the amount transported out of blood back into the gut lumen.
What enters the urine is the sum of oxalate filtered by the kidneys (the product of the glomerular filtration rate and the concentration of oxalate in blood that can be filtered – so called ultrafilterable oxalate) plus the amount of oxalate secreted by renal tubular epithelial cells, minus the amount of oxalate those cells reabsorb from tubule fluid back into blood. .
Since oxalate cannot be metabolized – destroyed – by the cells of the human body, these two sums must equal each other. This is the basis for the equation at the right of the drawing.
Because of this equality you can express the serum oxalate in terms of gut and renal transporters and liver oxalate production. So the net sum of production and renal handling can affect blood oxalate concentration as well as urine oxalate excretion.
Just from the number of transporters you might imagine evolution has given this molecule more than passing interest despite its utter lack of apparent biological value in us. We would like to think this interest is indeed because too much of it in urine or too high a concentration in blood has always threatened our species with extinction. But this is simple musing and I have no proof.
My colleague Hatim Hassan (pictured above) has graciously agreed to join me in writing this article, and bring his much larger knowledge of the transporters and their biology.
Urine Oxalate and Risk of Kidney Stones
The most useful data about urine oxalate we have so far is from three cohorts studied by Dr. Gary Curhan. Two are cohorts of nurses, one a cohort of physicians. These people have kept track of many aspects of diet and health for decades, and among their records are onset of kidney stones.
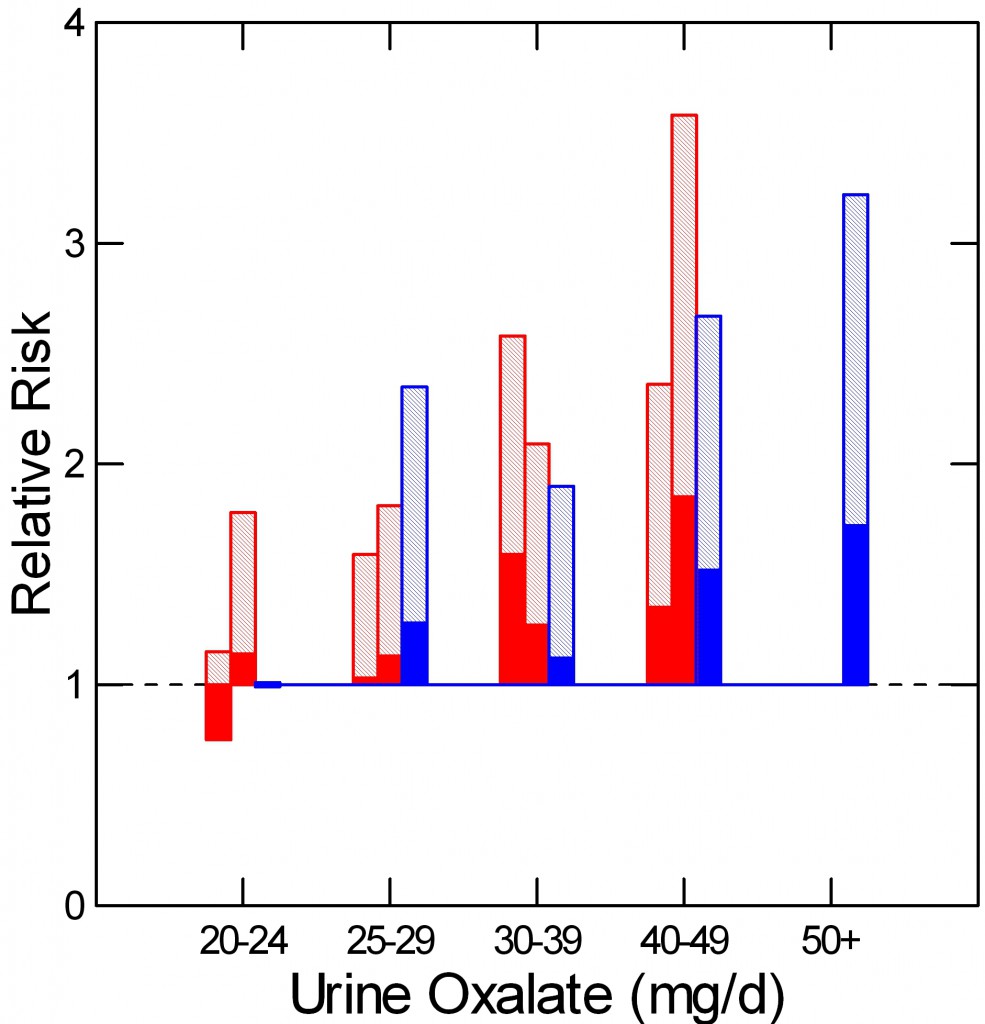 As he did for urine calcium, Curhan measured urine oxalate in properly selected subgroups from each cohort, including people who did and did not begin forming stones. From these samples he could calculate the relative risk of new onset of stones in relation to 24 hour urine oxalate excretion.
The two nurse cohorts are red, the physicians – all men – are blue. The dotted line at 1 is the risk threshold: Above that line, risk is present.
The top of each crosshatched bar shows the mean relative risk for each of the five urine oxalate ranges. Clearly the mean goes up as urine oxalate goes up.
But the mean relative risk has a range of uncertainty around it. The bottom of the solid portion of each bar is the lower 95th percentile for that range of uncertainty. When that bottom lies above 1, risk is very likely to be present.
For both the women and men groups, that point is reached between 25 and 30 mg of urine oxalate a day. Therefore one wants to try to get urine oxalate below 30 mg daily and even lower, below 25 mg daily if possible. The average urine oxalate excretion among the women in this study was close – 26 and 28 mg/day for those who did not form stones and just a bit higher for those who did – 28 and 30 mg per day. The men are a problem: 39 and 41 mg/day for those who did not and those who did form stones.
We have already pointed out that urine oxalate is the sum of oxalate absorbed from food plus the amount produced by the liver minus the amount secreted back from blood into the gut lumen. Of these, we can control mainly the amount in food.
Absorption of Oxalate from Food
This section is modified from its original version in our article on how to eat a low oxalate diet.
All dietary advice depends on having a reasonable goal in mind for oxalate intake. A goal of 50 to 100 mg of oxalate from food daily is not unreasonable given the research that has been done in normal people and stone formers.
Holmes and colleagues found a urine excretion of oxalate of about 10 mg/gm urine creatinine in normal  people eating a synthetic oxalate free high calcium diet (graph at left). As diet oxalate increased from 0 to 10 mg/2500 kcal/d, urine oxalate rose steeply from 10 to 14 mg/gm urine creatinine. It rose more slowly, from 14 to barely 15 mg/gm urine creatinine as diet oxalate was increased to 50 mg/2500 kcal/d, and more or less at the same slope thereafter so that an increase from 50 mg/2500 kcal/d up to 250 mg/2500 kcal/d increased urine oxalate only from 14 to 18. The closed symbols are whole food, the open symbols synthetic diets.
From this work the percent oxalate absorbed could be calculated as around 10 – 15% and the contribution of diet oxalate to urine oxalate excretion as around 25 – 40% when intake of oxalate was between 50 and 350 mg/2500 kcal. Therefore one can consider a whole food 1000 mg calcium 50 mg oxalate as a usable low oxalate diet, and a 150 -250 mg oxalate diet as relatively high.
The balance between diet calcium and diet oxalate does not matter greatly if diet calcium is high. Among normal men and women eating 1000 mg/day of calcium and 750 mg/day of food oxalate, 24 hour urine calcium was about 110 mg/day and oxalate about 44 mg/day.
If the calcium oxalate balance is altered so calcium intake is 400 mg and oxalate intake is 20 mg of oxalate at breakfast and lunch, and dinner contains 200 mg of calcium and 710 mg of oxalate, urine oxalate was only slightly higher after such a high oxalate dinner than with simply 333 mg of calcium and 250 mg of oxalate in all 3 daily meals. This means that when diet calcium is at least 1000 mg daily the balance of calcium to oxalate within any one meal is not likely to affect stone risk.
Seiner and colleagues make clear that stone formers are different from normal people. They divided male and female stone formers into 2 groups of 93 people each, one with urine oxalate above 0.5 mmol (~50 mg) of urine oxalate daily and the other with urine oxalate below 0.4 mmol (~40 mg) daily. They found virtually identical calcium and oxalate intakes: 845 vs. 812 calcium and 101 vs. 130 mg daily of oxalate respectively in the lower and higher urine oxalate groups. But the below 0.4 mmol group excreted only 27 mg of oxalate daily on average, whereas the high oxalate group excreted 64 mg daily. In other words diet was not responsible for the higher urine oxalate excretion, suggesting a difference of oxalate absorption. Those prone to high oxalate excretion seem, therefore, to most need diet modification.
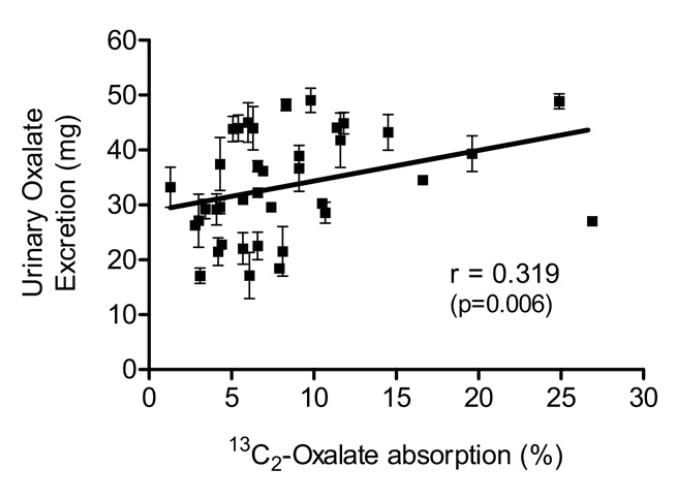
Knight and colleagues found a wide range of oxalate absorption among 38 calcium oxalate stone formers eating a self choice diet. Urine oxalate excretion (vertical axis) varied with percent of diet oxalate absorbed (horizontal axis). The mean absorption centered around 5%; a few outliers absorbed over 15% up to 25%.
Among those with percent absorptions below 10% urine oxalate hardly varied with percent absorption. As percent absorption rises above 10% the relationship becomes obvious.
This supports what Seiner found – some stone formers will have urine oxalate levels very responsive to diet oxalate and sans a research protocol to measure percent oxalate absorption we will not know. This is another good reason to keep diet oxalate low – 50 to 100 mg if possible.
Protein and Gelatin
Diet protein intake does not affect urine oxalate excretion. In 11 normal people fed a 1000 mg calcium, 51 mg oxalate, 3000 mg sodium fixed diet, varying protein intake from 0.6 to 1.6 gm/kg/day – a very wide range – did not alter urine oxalate appreciably (mean values were 23, 23, and 25 mg daily for the three protein intakes) even though oxalate precursors like glycolate rose markedly (25, 22, and 46, mg daily).
Jello is a source of hydroxyproline which converts to glycolate and oxalate, and oral loading with gelatin can raise urine oxalate. Ten normal people eating a 1000 mg calcium, 150 mg oxalate diet (typical normal level) were fed supplemental gelatin as one quarter of daily protein intake. Urine oxalate was 24 mg daily vs. 17 mg daily when the same diet was supplemented with whey protein – containing little hydroxyproline – as a control. So lots of jello is not an ideal plan for stone formers.
Where does this leave us about how much oxalate is alright for a day? If diet calcium is high, as it should be, at about 1000 mg, then one should try to limit diet oxalate below 100 and even to 50 mg daily. Perhaps this is most important in those patients whose baseline oxalate excretions are higher – in the range of above 40 mg daily.
Renal Oxalate Handling
We do not usually feature our own work here, but we in fact performed the most complete recent experiments concerning secretion and reabsorption of oxalate by kidney tubules so our paper is the best source for now. For that research we studied eight normal people, 18 patients with calcium stones, and two patients with bariatric surgery for weight loss who developed stones from the high urine oxalate that surgery can produce. Risk of stones is increased by such surgery.
We are fortunately able to measure not only urine but also serum oxalate concentrations which two, taken together, let us estimate what kidney cells are doing in the fasting state and with meals.
A View of the Nephron
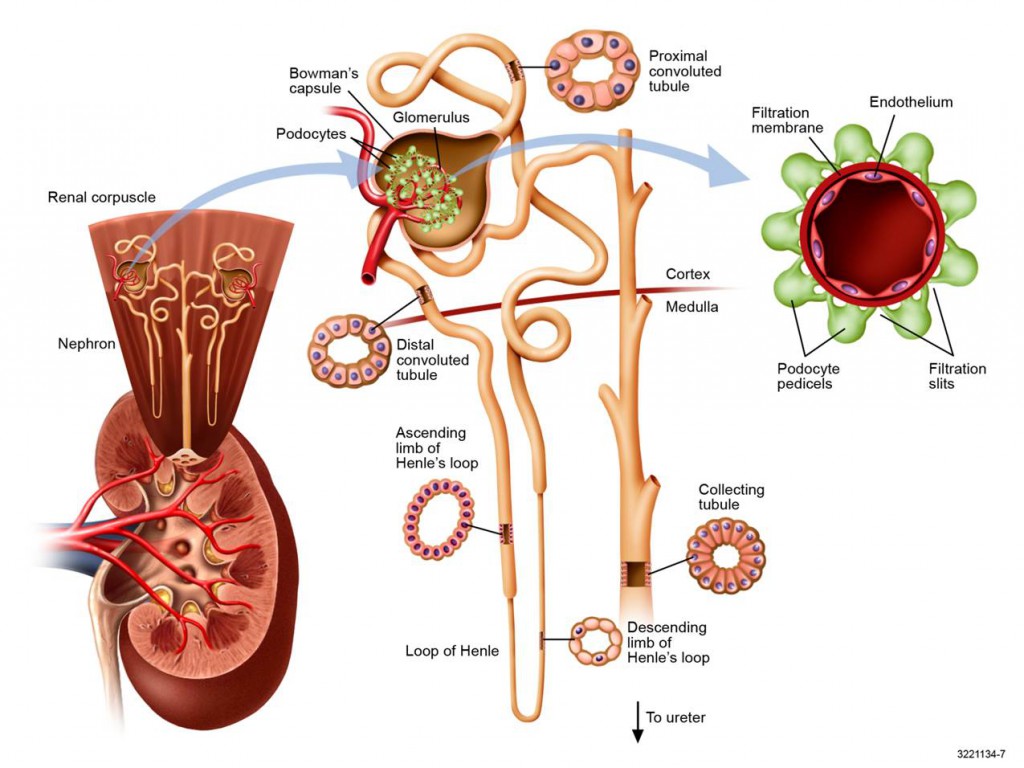 I have needed a good picture of the nephron and got this one from Professor John Lieske at Mayo Clinic. To the lower left is a whole kidney with a cutaway view into the pelvis and an upward exploded view of two nephrons all coiled up in the cortex. One is pulled out into the middle. These nephrons are made mostly before birth and for a short time thereafter, but never again after that, so it does not do to lose any more than arises from natural obsolescence.
Each of the million or so nephrons in a kidney begins with a filtration device (glomerulus), which is a tuft of capillaries surrounded with cells (podocytes) that modulate and control the filtration out of blood of a vast array of small molecules, one of which is oxalate, others of which are sodium and calcium which we have discussed in other articles.
The right hand panel shows a view along one capillary as if you were the size of a red blood cell and filming it facing forward.
If you uncoil one nephron it would be about 3 cm long and very thin – about a human hair – with a tiny channel running through it. The earliest (nearest the glomerulus) part of the nephron concerns us here, the proximal tubule, for that is where all of the action occurs for oxalate.
Like the whole nephron, the wall of the proximal tubule is a single layer of epithelial cells drawn in as a cross section at the upper middle of this figure. Just as oxalate or other small molecules can enter the tubule from filtration it can enter by going through these cells from the blood – so called secretion, or be taken back into the blood through the cells – reabsorption.
Filtration of Oxalate
How can we measure filtration by these tiny capillary beds inside a person? It is easy if you have the right molecule: Filtered and then simply passed along the nephron into the urine. Suppose the filters – glomeruli – of the two kidneys are producing 100 ml per minute of filtration; the amount of this ‘right’ molecule in the urine will be 100 ml/min times its concentration in the blood filtrate. Let’s say the molecule we use is 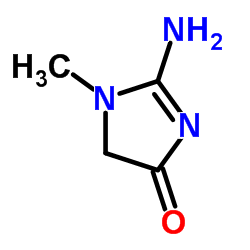 creatinine (pictured to the left), and it has the properties we want, and let’s say what happens to it in that lovely other language that can seem surprisingly difficult sometimes:
Eq 1: [Cr]u x V = g x [Cr]f
where Cr is creatinine, [ ] means concentration, u and f are urine and filtrate, V is the volume flow of urine, and g is the hidden filtration rate we want to measure. Since this is an equation of two factors, and we can divide both sides by any one thing without altering the equality:
Eq 2: g = [Cr]u x V / [Cr]f
This gives us the rate at which filtrate is being formed. The amount of oxalate filtered is simply [Ox]f X g, where [Ox]f is the concentration of oxalate in the filtrate. How do we know the concentrations in filtrate? We filter serum through a membrane that has properties like those of the glomerular filter and measure the concentrations we want to know. So we do really know how much oxalate is filtered every – let us say – minute, or hour.
A Moment of Pause to Consider Creatinine
Creatinine is measured as part of most routine blood samples taken in the course of medical care and used to estimate kidney function – glomerular filtration in fact. The molecule is not simple – it has a ring of 2 nitrogens (N) and 3 carbon atoms (the angles in the ring) plus 3 side chains: an oxygen atom, an amine (NH2) and a methane (CH3). It is easy to measure on automated equipment – a virtue, and all commercial methods can be calibrated against (‘traceable’ to) standard serum samples whose creatinine concentration has been determined by very complex but also very accurate techniques.
Creatinine is a product of muscle metabolism, and as such is generally produced at a rather constant rate day by day and even minute by minute. So the urine creatinine excretion is constant as well and is the product of serum creatinine times filtration rate. This means that if filtration rate goes down for any reason, serum creatinine must go up in exact proportion, and it is for this reason that serum creatinine is widely used to assess filtration rate in clinical practice.
But, that assessment is naturally prone to error. The product of serum creatinine and filtration rate equals the urine creatinine excretion, but you do not know that excretion from just the serum creatinine value, so you have to assume some ‘normal’ value based on weight, sex, age, or population surveys. Or, you can ‘calibrate’ serum creatinine to true measures of filtration made in study populations, which was done to achieve the so called eGFR widely printed on routine laboratory reports.
All this is by way of introducing creatinine clearance, which we have used to measure how kidney cells handle oxalate. In our work we measured urine creatinine excretion minute by minute, so we had the correct values for filtration within the limits of creatinine itself. In fact creatinine is not a pure marker of filtration: It is secreted by proximal kidney tubule cells. It is only the fact that in otherwise normal people this secretory element is constant and relatively minor in comparison to filtration that makes our rather elaborate analysis useful and reliable.
Secretion and Reabsorption of Filtered Oxalate
If you know how much oxalate is filtered in a given amount of time, and how much ends up in the urine in that same time, it is pretty easy to calculate secretion and reabsorption:
Eq 3: [Ox]u x V = r x [Ox]f x g
where r is the fraction of filtered oxalate ([Ox]f x g) that is left to enter the urine. When the amount in the urine exceeds the amount filtered, r is above 1 and a measure of how much oxalate, as a fraction of the amount filtered, has entered into the tubules through the cells, by secretion. When the amount in the urine is less than the amount filtered r is below 1 and indicates how much oxalate, as a fraction of the amount filtered, has been taken back out of the tubules into the blood through the cells, by reabsorption.
Eq 4: r = ([Ox]u x V) /(g x [Ox]f )
If you remember, g has urine volume flow (V) in it, so if we substitute Eq 2 for g in Eq 4 we get rid of urine volume:
Eq 5: r = ( [Ox]u x [Cr]f ) /([Ox]f x [Cr]u), essentially the urine to filtrate oxalate ratio divided by the urine to filtrate creatinine ratio [u/f]cr. This ratio is essentially the amount to which creatinine filtered at filtrate concentrations has been concentrated to achieve the urine concentration by extraction of water along the nephron – remember creatinine has been assumed to be filtered with r = 1.
This would be true and of modest interest except that – as Dr Hassan will point out – all of the secretion and reabsorption of oxalate occurs in the proximal tubule and from then on whatever leaves that segment is carried into the final urine. So deviation of r from 1 for oxalate occurs in the proximal tubule only and the minimal concentration of oxalate there is given by correcting the urine concentration for all of the water that has been reabsorbed:
Eq 6: Adj Ox = ([Ox]u)/([u/f]cr). This is a value of concentration for oxalate assuming no water has been extracted and will be above [Ox]f or below depending on secretion or reabsorption. If from the Adj Ox you subtract the filtrate oxalate concentration you get what we have called the transepithelial oxalate concentration difference:
Eq 7: TTOx = Adj Ox – [Ox]f
This is the minimum concentration difference the kidney cells – mostly or entirely proximal tubule cells – have established between the fluid in the tubule and the blood filtrate.
Effects of Meals
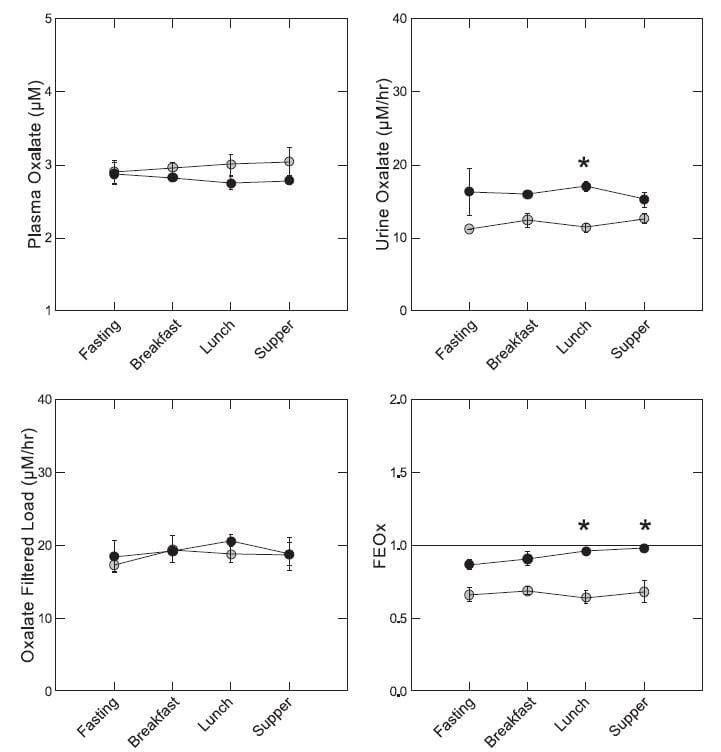 In our experiment, everyone ate the same food throughout a day of study. The diet was modest in oxalate – 92 mg and high in calcium 1,200 mg for a 1,800 kcal base diet. So it was the kind of diet in which food oxalate would not be expected to influence urine oxalate very markedly.
On average plasma oxalate – measured in an ultrafiltrate of plasma because it is technically necessary and valid because all plasma oxalate is filterable – was lower in patients (solid black circles) by lunch and supper time (upper left panel), although the differences were not statistically significant. Urine oxalate of patients exceeded that of normals all day but the difference was significant only at the *. Filtered load of oxalate was the same for normal and patients all day long. Notice that meals had no effect on urine or filtered oxalate. The fraction of filtered oxalate excreted (FEOx, Eq 5 here) was higher in patients than normal later in the day because although patients excreted more oxalate their filtered load was no different than normal.
If we sum up, fasting plasma oxalate and oxalate filtered load of patients and normals were not different, but urine oxalate was higher on average in patients by 5.1 uM/hour (95% CI 0.4 – 9.8). The fractional excretion was higher on average by 21% (4 – 38% for the 95% CI), and the TTOx was higher by 0.69 uM (0.13 -1.25). Fed, the differences were larger: 7 uM/hr higher excretion, 28% higher FEOx, and 0.99 higher TTOx – all highly significant.
So patients lost more oxalate in their urine than normal people did both while fasting and while both groups ate the same foods, and the difference is due to tubule cell handling of oxalate.
This raises a lot of questions we could not answer. For example where did the extra oxalate come from? It could not be that the kidneys raised urine oxalate by altering tubule cell reabsorption. That would simply lower plasma oxalate concentration. Patients either make more oxalate in their livers (see the big figure at the beginning of this article) or absorb more oxalate from the diet we fed them. We could not tell.
Secretion and Higher Urine Oxalate Excretion
If all the kidneys could do is filter oxalate, and the tubule cells could not secrete it from blood into the tubule fluid and thence the urine, the only way ‘more’ oxalate – from diet or liver production – could get into the urine would be a higher blood oxalate concentration. This is true because glomerular filtration rate is not set by how much oxalate must be excreted but by other factors utterly unrelated to oxalate which is, after all, merely a waste product of metabolism.
But that is not the case. Patients excreted more oxalate than normal people and yet had generally lower filtrate – and therefore serum – oxalate concentrations (look at the upper left panel of the figure just above. Secretion was higher, or reabsorption lower, all the time, or – better said – the fraction of filtered oxalate delivered into the urine was higher.
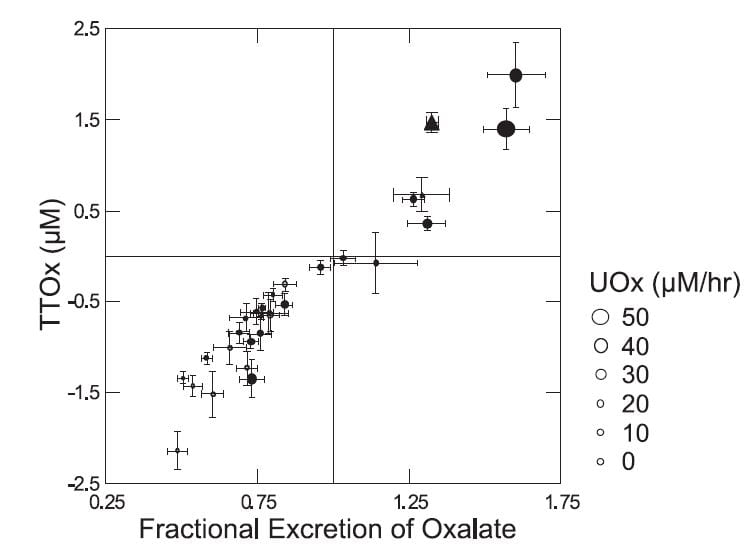 The actual behavior of the tubule cells was indeed nuanced and rather elegant. They acted always in a way that kept serum oxalate rather constant.
The higher the urine oxalate excretion – size of the symbols (Figure to the left) – the higher the FEOx, and, of course, the higher the transepithelial oxalate concentration difference – TTOx. Normal people (grey circles) all clustered at the lower left. Patients – black symbols – tended to higher excretions. Seven patients, two of them bariatric weight loss surgery patients in triangles, secreted oxalate.
How the tubule cells ‘know’ to secrete is not clear as we found no relationship between secretion and serum oxalate – not shown but obvious from the fact that it was the patients who secreted and patients had lower serum oxalate levels than normals.
But a closer look shows that there is something about being a stone forming patient. When we plotted the adjusted urine oxalate concentration – the minimal proximal tubule oxalate concentration – against the plasma oxalate concentration (Figure to the right) normal people and patients displayed remarkably different responses. 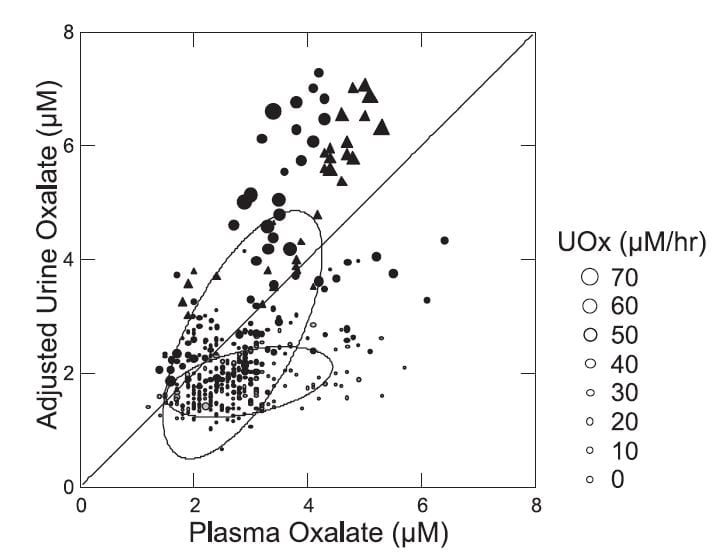
The normals (gray small circles within the lower nearly flat ellipse) showed almost no dependence of the adjusted value on the plasma value. This means that as plasma oxalate was higher there was no corresponding increase in the minimal calculated tubule fluid oxalate concentration.
The patients were utterly different (black circles and triangles within and in line with the larger tilted ellipse). As plasma oxalate rose, tubule fluid oxalate rose in proportion, and highest values were in the patients with the highest urine oxalate losses (larger symbols). Bariatric patients (triangles) and ordinary stone formers aligned along a single upward sloping track. The diagonal line of identity is crucial for interpretation. Points above it mean net oxalate secretion, those below net reabsorption.
So in normal people higher plasma oxalate concentrations were not associated with net secretion but rather with reabsorption. In patients higher plasma oxalate concentrations associated with higher secretion, in a progressive fashion. While the ‘purpose’ of this biology within the evolution of the kidney cannot be deduced from this work, the effect is obvious: The tubule cells are acting so as to maintain plasma oxalate concentration constant as possible as the movement of oxalate into the urine increases.
Oxalate Transporters and their Regulation
Our descriptive paper tells us only what kidneys do in the course of eating but not how they do it nor what factors control the loads of oxalate presented to them for excretion. To pursue these issues we need to name and grapple with the membrane transport proteins through which oxalate can move from gut lumen to blood or the reverse, and from blood to tubule fluid in the nephron and the reverse – see the large picture heading this article.
The kidneys themselves cannot alter urine oxalate for very long; they can only regulate the relationship between oxalate excretion and serum oxalate concentration. What controls urine oxalate excretion is the interaction between oxalate production and the net of intestinal oxalate absorption from foods and secretion from blood back into the gut lumen.
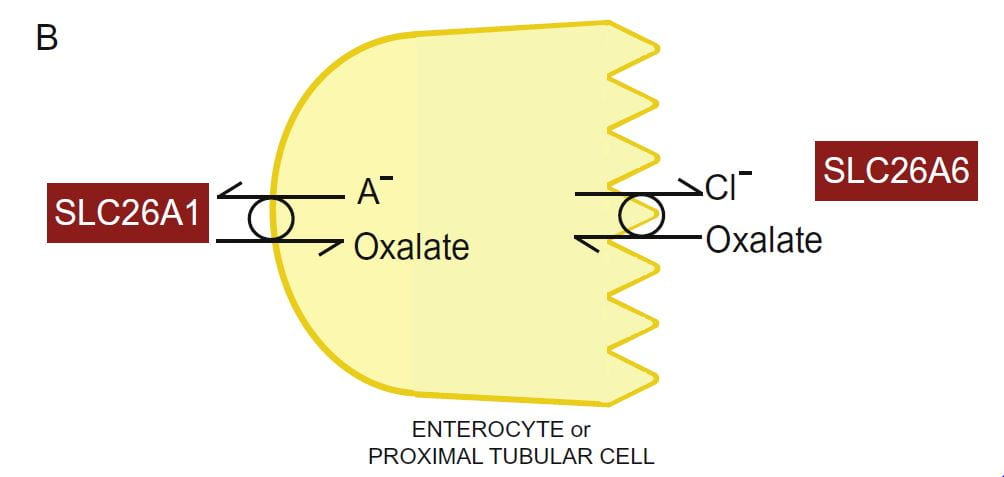 Two transporters with unlikely and multiple names move oxalate through kidney proximal tubule and intestinal cells: SLC26A1 (also named A1 or SAT1), and SLC26A6 (also named A6, CFEX and PAT1) for historical and other reasons. Because the multiple names can be confusing only the SLC types appear here.
The drawing portrays the lumen (urine or food) side of the kidney or gut cell (apical side) as serrated. The blood side (basolateral side) is smooth.
Oxalate secretion by renal proximal tubular cells or intestinal epithelial cells involves oxalate entry into the respective cell from blood, a process in which A1 plays a role, and then its efflux from the cell into the urine or gut lumen. A6 plays a critical role in the latter process.
Abnormalities of the A1 transporter are not known to cause any human disease, but if the gene for it is deleted in rodents (A1 null mice) urine oxalate rises. The increase is not due to higher oxalate production, so one is left with reduced secretion of oxalate from blood into the gut lumen.
The mechanisms for their higher urine oxalate can be studied directly but only in animals and membranes prepared from their renal and gut cells. The A1 and A6 transporters reside in the basolateral (blood side) and apical (urine or food side) of GI and renal cells respectively. One can study the cells or, more conveniently, the membranes, which when properly processed and separated from the cells spontaneously form into tiny spheres – vesicles – whose walls contain the transporters of interest.
Basolateral membrane vesicles from distal ileum, cecum, and proximal colon of A1 null mice have significantly reduced oxalate uptake. In the intact gut, cecal oxalate content is reduced. This speaks to reduced oxalate secretion from blood into the gut lumen. Endogenous hepatic oxalate production is normal. A1 could mediate oxalate entry from blood into gut cells in exchange for sulfate or bicarbonate in the cells – the anion (A–) – in the drawing above.
Putting all this together indicates that the high serum and urine oxalate in these mice is most likely due to reduced intestinal oxalate secretion. The oxalate enters the urine mainly by increased oxalate filtration, as one would expect A1 deletion to reduce oxalate secretion by the proximal tubule cells. Loss of renal cell secretion combined with loss of gut secretion would result in higher than normal serum oxalate concentrations.
A gender difference in the expression of A1 protein in the liver and kidney (in the basolateral membranes of proximal tubule cells) has been reported: A1 expression in vivo is higher in in male compared to female rats. This difference is explained by the observation that female sex hormones posttranscriptionally decrease A1 protein levels in the rat liver (and possibly in the kidneys).
In agreement with the higher A1 protein expression, membrane vesicles isolated from the liver and kidney of male rats have significantly higher sulfate-oxalate exchange (uptake of sulfate and extrusion of oxalate) which, in the liver, can lead to elevated oxalate production and plasma oxalate levels. As expected from their increased A1 expression male rats have significantly higher plasma (~1.8-fold) and urine (~2-fold) oxalate levels compared to females, and a higher rate of renal oxalate secretion. This gender difference in A1 protein expression, if present in humans, might potentially contribute to the reported predominance of calcium oxalate kidney stones in men.
Because the A1 transporter also transports sulfate, as noted above, its deletion lowers serum sulfate but raises urine sulfate excretion. These latter abnormalities have no relationship to stone disease, our topic here, and are therefore not discussed further.
Abnormalities of the A6 transporter also are not known to cause any human diseases, but if the gene for it is deleted in rodents (A6 null mice) urine oxalate increases and the A6 null mice produce calcium oxalate renal stones.
A6 null mice have a critical defect in intestinal oxalate secretion (from blood to the gut lumen), leading to enhanced net absorption of ingested oxalate, and hence to high serum oxalate concentrations and high urine oxalate excretion. As such they are like the A1 null mice: Loss of GI secretion of oxalate imposes an increased demand for renal oxalate removal. In normal mice A6-mediated intestinal oxalate secretion limits net intestinal absorption of dietary oxalate, which prevents hyperoxaluria and calcium oxalate kidney stones.
Studies of anion exchange activities in renal brush border membrane vesicles from wild-type and A6 null mice reveal that A6 is responsible for all of the apical Cl-oxalate exchange activity in proximal tubule cells. As in A1 null mice, urine oxalate removal must be mainly via increased filtration of oxalate, as loss of apical Cl-oxalate transport in the proximal tubule of A6 null mice would be expected to reduce rather than increase urinary oxalate secretion.
Given the essential roles of A1 and A6-mediated intestinal oxalate secretion in preventing hyperoxaluria and related kidney stones in rodents, there is the possibility that elucidation of the molecular mechanisms regulating A1 and A6 in humans might lead to new treatments that enhance human intestinal oxalate secretion (e.g. by either enhancing a stimulatory pathway or antagonizing an inhibitory pathway).
We found that protein kinase C (PKC) activation reduced A6-mediated Cl-oxalate exchange activity in human intestinal epithelial cells grown in tissue culture by reducing A6 surface expression. Using intestinal tissues from rats mounted in Ussing chambers – a well established in vitro research technique for measuring transport of molecules like oxalate into and out of blood – we also found that protein kinase C (PKC) activation decreased unidirectional mouse duodenal oxalate secretion, a process largely mediated by A6, reflecting the physiological relevance of the findings in cultured cells.
We also found that the cholinergic receptor agonist carbachol and the extracellular nucleotides (ATP and UTP) negatively regulate A6 activity in vitro (by reducing its surface expression) through PKC-delta activation in cultured human intestinal epithelial cells. Since supraphysiological levels of ATP and UTP are seen in the setting of IBD, the ATP – and UTP-mediated inhibition of A6 transport activity might have potential relevance to the pathophysiology of IBD-associated hyperoxaluria if similar regulation is also observed in vivo.
A major component of intestinal oxalate absorption has been shown to be passive through the paracellular pathway and driven by the prevailing electrochemical gradient. On the other hand, SLC26A3 (A3; also named DRA and is known to be mutated in chloride losing diarrhea in humans) plays an important role in active transcellular intestinal oxalate absorption. Rodents deleted for the A3 gene show a change in urine oxalate but in a downward direction. Direct studies of GI epithelia showed that absorption of oxalate had fallen. So, just as loss of A6 reduces secretion of oxalate, deletion of A3 reduces absorption of oxalate. In essence, net intestinal absorption of ingested oxalate depends on the relative balance of absorption (both passive paracellular and active transcellular) and A6-mediated active transcellular intestinal oxalate secretion. While regulation of A3-mediated Cl-HCO3 and Cl-OH exchange activities has been extensively studied, regulation of A3-mediated Cl-oxalate exchange activity and its relevance to oxalate homeostasis remains unknown.
If one considers the matter, this all makes sense. The A1 and A6 are dual conduits for oxalate movement through proximal tubule cells in the kidneys and GI cells in the gut. It would appear that secretion from blood into gut lumen is the favored direction, whereas in kidney it must be that both secretion and reabsorption can occur because we found both in humans. Therefore if you interrupt either carrier GI secretion is lost and oxalate delivery into the urine increases, the molecule being no longer removed in the stool.
In the case of A3, deletion studies show what may well be an active absorption pathway for oxalate. Gene abnormalities cause diarrhea and the reduced urine oxalate excretion would not itself produce any additional human disease, and may well escape notice.
That urine oxalate rises with A1 or A6 deletions means risk of high supersaturation and stones will be present, and depending on the exact situation in the rodents involved actual stones may or may not occur. This latter is not very important in that high urine oxalate is itself the key outcome and supersaturation as a cause of stones and crystals an established aspect of physical chemistry.
So far no one has found any abnormalities of the A1 and A6 transporters in humans. This leaves open whether what we know about these transporters can benefit evaluation and treatment of patients with stone disease. Perhaps it is not a matter of genetic defects but of abnormal regulation which affects GI oxalate transport and therefore urine oxalate.
But, if we remember the findings of Seiner and Knight reviewed earlier in this article, and that the stone formers on our own CRC study excreted more oxalate than normals eating the identical diet, the impression forces itself on one’s mind that GI transporters may indeed function differently in stone formers, in a manner increases net oxalate absorption. This could be an increase in A3 absorption or a decrease in A1 and/or A6 mediated secretion. More direct measurements of oxalate transport in humans are needed to resolve this matter.
What Makes the Transporters Run?
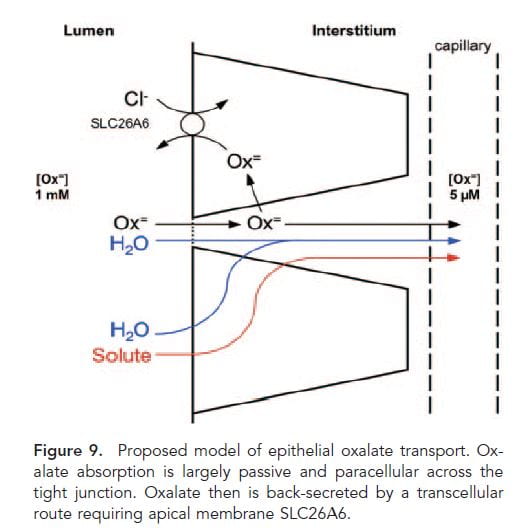 We have been speaking about A1 and A6 as if they somehow magically move oxalate from one side of the intestine or renal tubule to the other, but never speak about the source of their power to move it. This matter is especially crucial when we speak of the intestines, because the amount of oxalate in the urine is the net sum of what is produced, what is secreted from blood into the gut lumen, and that is taken up from the lumen from food into the blood.
This nifty drawing from a paper in 2011 gives a nice vision of how things probably work. You will notice that A3 is not given a place because the proof that A3 is important in absorbing oxalate into the blood was first presented in 2013.
Oxalate is absorbed into the blood from food (Lumen side) passively between cells (through the ‘tight junctions’ between cells and actively secreted back out of the blood by the A1 A6 combination.
These two transporters mainly move oxalate in exchange for other anions. A1 moves oxalate into gut cells in exchange for sulfate and/or bicarbonate in the cells. Once in the cells, oxalate is secreted into the gut lumen by A6 in exchange for chloride ion in the gut lumen. This movement of chloride is driven by a higher concentration of chloride in the gut lumen than in the cells. In turn, chloride in the gut lumen arises from food and large scale movements of bicarbonate and chloride from secretions which are bound up in the main work of the intestines with respect to electrolyte metabolism and beyond the range of this article.
So oxalate is moved in what may well be a regulated manner, coasting along as if a surfer on the shoulders of much more massive ion movements which have altogether other purposes and may be as indifferent to oxalate as the wave to its frail and insignificant rider.
Where Does GI Oxalate Transport Occur?
In humans we do not know. But one site we do know about. If the entire colon is removed – because of cancer, or bowel disease – urine oxalate does not rise. This means that new secretion of oxalate by the colon cannot be essential to oxalate balance. On the other hand if small intestine is removed and the colon left in place, urine oxalate can rise a lot – so called enteric hyperoxaluria. If the colon is then removed in such people urine oxalate falls again to normal. This suggests colon is a site of passive oxalate absorption, and active secretion occurs above it, in the small bowel. The exact sites in humans remain to be discovered.
Oxalate and Citrate
One might not think to connect urine oxalate and citrate excretions. There is no natural instinct to link them. However, Moe and colleagues reasoned that perhaps higher oxalate transport by A6, which would increase urine excretion and GI oxalate secretion from blood into the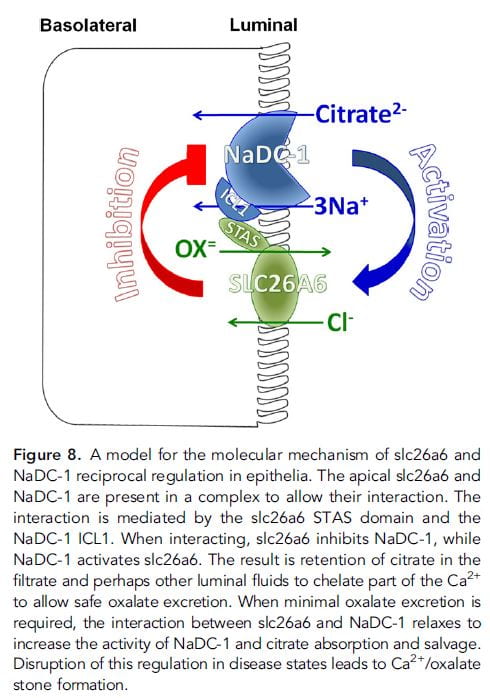 GI tract lumen, might coordinate with the citrate transporter NaDC-1 (Slc13a2, 13A2) which is present both in the kidney tubule and GI tract. If activation of A6 reciprocally inhibited renal 13A2, then more oxalate in urine would be linked to more citrate – less reabsorption.
In fact, in mice without the A6 transporter – deleted genetically, urine citrate is low compared to the wild – unaltered – parent strain: low A6 activity, high 13a2. In elaborate studies not ideal for presentation here, they found a link between the two transporters which could create reciprocal transport. The schematic to the right is printed with its extensive legend for those brave enough to fathom it.
The result – were this mechanism active in humans – would be complex. At the kidney level, higher secretion of oxalate into the tubule fluid – in order to eliminate higher oxalate production or GI absorption – would suppress 13a2 so increased citrate could balance the oxalate stone risk by binding calcium in tubule fluid and the final urine. In the intestine, however, increased oxalate secretion from – for example – oxalate absorption from a high oxalate diet would reduce citrate absorption, so less would be absorbed. This might or might not affect renal citrate excretion, because citrate is available from many metabolic sources.
But if oxalate load presented to the kidney were increased, by some imbalances between secretion and reabsorption, by increased production, by simple diet oxalate loading, the higher loss of urine oxalate would presumably engage renal oxalate secretion because that is what we found and demonstrated to you in the preceding section: Higher urine oxalate in stone formers led to increased secretion. This increase would be expected to reduce citrate reabsorption so more citrate would appear in the urine.
Thus far, no human data are available to test the idea.
Oxalate Degrading Bacteria
A number of bacteria can metabolize oxalate, and one of them, oxalobacter formigines, has been studied as both a cause of stones – in being deficient in the gut flora, and a possible treatment of stones – given as a probiotic.
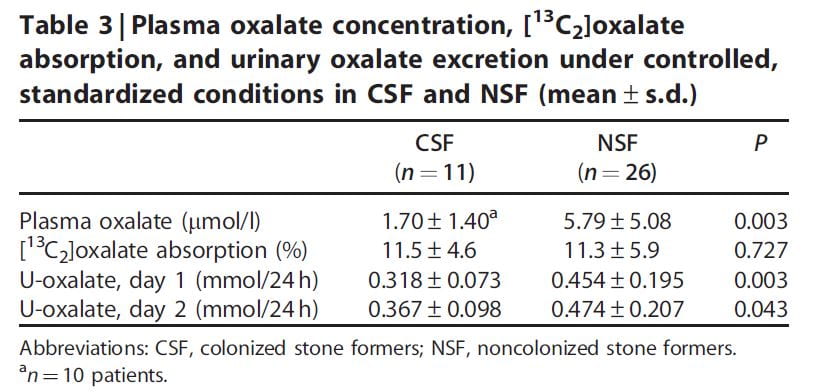 One research paper reports evidence for increased urine oxalate in idiopathic calcium oxalate stone formers who were not colonized with oxalobacter vs. those who were not colonized (Table). These patients were all eating a specific diet (not detailed in the paper). The urine oxalate was higher in the non colonized patients on day one of the study but the significance of the difference was marginal by day 2 on the diet.
The percent of diet oxalate absorbed estimated using an isotope tracer was the same in both groups.
A surprize was that the plasma oxalate was higher in the uncolonized patients, meaning that renal tubule secretion was not acting such as to maintain a normal plasma oxalate level such as we had found in our own work detailed earlier in this article. In fact, since the plasma oxalate was about 4 times higher, and creatinine clearances about the same for the two groups, filtered load of oxalate was 4 times higher without colonization, yet urine excretion was only 1.5 times higher: Tubule cells were reabsorbing oxalate. There was an inverse correlation between the fraction of patients colonized and the number of stone episodes but as the authors point out this could have been post hoc: Stone episodes often involve antibiotic use which could snuff oxalobacter out.
A very recent review of this topic delivers a modest verdict: To date, evidence for either a role in stone pathogenesis or as a treatment is sketchy and not convincing enough to consider the matter clinically. Research is ongoing, and ultimately the gut flora may or may not prove of interest to patients and their physicians.



Wow, that’s a lot to take in…and some I didn’t understand. I have been reading yalls emails every time they r sent, for a few months now. Very interesting and informative stuff!! I’ve passed over 230 stones since August of 2014. And this helps, thank you!!
Hi Christina, I warned everyone! With all those stones, where is your prevention program?? All the best, Fred Coe
So interesting and intriguing but at the same time so complex and still such a mystery to Drs treating our MSK group members for recurrent calcium oxalate stones, the same who also appear to suffer from chronic infections (whether kidney or uti’s). I find the reference to ‘the critical roles of A1 and A6 transporters in oxlate secretion by renal proximal tubular cells or intestinal cells’ quite interesting!
Quote “Given the essential roles of A1 and A6-mediated intestinal oxalate secretion in preventing hyperoxaluria and related kidney stones in rodents, there is the possibility that elucidation of the molecular mechanisms regulating A1 and A6 in humans might lead to new treatments that enhance human intestinal oxalate secretion”.
Also interesting the reference to a possible connection between urine oxalate with citrate excretions. Most of our MSK members have low urine citrate.
But most of all the fact that research is ongoing is very promising and gives us hope!
Hi Celia, I am glad you liked the article and always enjoy hearing from you. Best, Fred
A few questions regarding oxalate. Please direct me accordingly if I have missed the answers within the website:
– is there any inverse relationship between the body’s production of oxalate and the amount ingested by diet?
– if <20% of oxalate is absorbed from food, would attempts to reduce diet oxalate be considered less effective than ensuring adequate calcium is consumed with diet oxalate?
– in what ratio do diet calcium and oxalate bind in the intestinal tract (ie. X mg of calcium to bind Y mg of oxalate)?
– are there elements other than calcium that can bind with oxalate in the intestinal tract, or degrade oxalate, to reduce absorption?
– since Vit. D enhances the absorption of calcium, will its consumption (whether by diet or supplement) reduce the volume of calcium and oxalate that bind in the intestinal tract?
Thank you very much.
Hi Michael, Thanks for your interesting questions. Production and absorption of oxalate are independent and additive. Reducing diet oxalate will of course reduce oxalate absorption but adequate calcium with food is an easier route since normal diets are supposed to contain 1000 to 1200 mg of calcium that can be targeted to the larger or higher oxalate meals. It is arduous to limit diet oxalate. As for the ratios I do not know. In general calcium and oxalate combine in equimolar ratios of 1:1 so I suppose that occurs in the GI tract. As for degrading oxalate there is an enzyme product being tested in trials that might become a helpful drug. No other elements than calcium are known to be safe and effective. Vitamin D is not said to increase urine oxalate. Regards, Fred Coe
dear fred, my daughter (11-yrs) is diagnosed with PH1. can anyone briefly and precisely tell whether treatment of PH1 is available in any corner of the world or not? also she is taking vita b6 with urocit k to control oxalate? how much this can helpful to her. i am from Pakistan. any advise to control and treat PH1. regards
Dear Azhur, It is a specialty at Mayo Clinic. Dr John Lieske is the head of the rare disease consortium there. I suggest you write to him directly. Regards, Fred
Dear Jill Harris and Dr. Coe. Thank you for this article. I clicked on it being a U of C alum and was glad I did. — I am 40, I have one kidney and after recovering from leaky gut 2 months ago, I still had symptoms that I now attribute to calcium deficiency (despite eating what I estimate on average was around 1000 mg’s of calcium a day). numbness and tingling in the extremities, muscle weakness, backache, stooped posture, tooth decay and other symptoms perhaps related to oxalate itself: pain in the knees walking up steps, mild gout in the foot. My uric acid level is at the upper limit of normal 410 µmol/l (but creatine and urea are normal)(no access to oxalate tests where I am right now) I am lactose intolerant so avoid dairy. I have gluten intolerance so avoid wheat. Two weeks ago after reading your article I started mixing in about 200 mg’s of coral calcium powder with 2 cups oatmeal with 30 almonds and 15 blueberries. At night I mix the same amount with quinoa with a mix of vegetables including beets, sweet potatoes…And symptoms seem to be lessening upon mixing in the calcium for the last two weeks, but I am concerned about the long term, expecially when having one kidney. 1) Is coral calcium a good long term choice, or am I better off with another one like calcium citrate? 2) Does mixing calcium powder in my meal have any drawbacks or pose any danger to my one kidney? (versus exploiting a high calcium food instead) 3) And is there some kind of rough numbers in the equation…. X calcium + Y oxalate = Z calcium absorbed in the gut, so I can figure out whether I should put in 200mg’s 300, 400 or more of the powder? Since I’ve heard having too much calcium can be very problematic as well. Thanks again for you help, Jonathan
Hi Jonathan, I found three versions of your comment that seemed successive iterations and took the liberty of deleting the first two – in temporal sequence – leaving this one that seems your final statement. I gather you have had symptoms compatible with low blood calcium – but no mention of whether blood calcium was indeed low, and an elevated blood uric acid level (6.9 in US mg%) and GI intolerance to gluten and lactose. You have only one kidney. You have improved your symptoms using coral calcium 200 mg twice daily. Coral calcium is calcium carbonate. Your question concerns potential kidney stone risk. Of course I can only guess about your problems from this distance but you are right to ask as potential kidney stone risk is indeed present and a concern. You are eating an alkaline calcium load with foods that produce some oxalate load and the final urine result is not exactly calculable. Likewise you are treating symptoms of low blood calcium sans evidence of low blood calcium. My advice – of which I am confident howsoever far away – is to stop this until you have a local physician who can help you in your endeavor. With only one kidney these kinds of dietary changes need blood and 24 hour urine monitoring for safety. Please do this. Regards, Fred Coe
Great website! I am reaching out here because I am at a loss of what to do next and hoping you could make a suggestion or two. My family Dr. retired more than 10 years and I have not been to a Dr. since. The past month I was feeling extremely weak, waking up 5-6-7 times every night and urinating every other time, I had light headaches that most days would start when I woke up until I went to bed and neck sweats and what looked like a black thread in my eye. I eat healthy and drink 2-3 liters of water daily. I have the urge and do urinate usually every hour as if I have to go, I go, I don’t hold it. I also drink a liter of green smoothie every morning, consisting of 4-5 handfuls of spinach, a half cup of plain greek yogurt, a couple oranges or a cup of strawberries and half a cup of coconut juice. I’ve been doing that for 10 years now. I also eat a handful of cashews and a cup or two of chai latte everyday. I was taking Vit C 1 gram capsules and zinc/copper 30mg/300mcg but stopped a year ago, still taking gelatin for my weak nails.
The Dr. at the clinic ordered blood and urine tests as he suspected Diabetic Retinopathy but all tests came back fine except for some blood in my urine and an abnormal EKG. I was retested and urine was fine but had blood in my stool, went for ultrasound and have a gallstone and fatty liver. The past week I have had bad lower back pain that seems to radiate all around through the front of my pelvis, and knee pain in both knees, I cannot do stairs more than one step up and I still have a headache all day long and loose orange color stools, still waking up but now 3-4 times a night. I have been sent to 4 specialists, ophthalmologist, rheumatologist, cardiologist and for a pap smear. The Drs (I have seen 2 different ones) are adamant that back pain is a pulled muscle or arthritis (I am 59) I am adamant that it is oxalates. I asked to be tested but Dr didn’t know of a test but said possibly a stool test would show oxalates but didn’t order one. I am going to try one more time with a different Dr. and was wondering if there are any tests I should ask for? My appointments with the specialists are next week.
I have stopped my green smoothies and cut out sugar, aside from my 2 daily Chai lattes and fruit, my neck sweats stopped immediately and my back pain has let up by half but it’s still bad enough to take some 10 year old percocet pills which lessen the pain for a couple hours. Am I unnecessarily concerned about oxalates and do you have any suggestions? Thank you for reading this long comment but I wanted to give you some background.
Hi V, oxalate itself is a metabolic end product with no effects apart from combination with calcium to form crystals. Urine oxalate is a common commercial measurement and might have been high from your prior diet but without stones or crystals in the urine would have little value for you. As for the back pain, pain that leads to narcotics needs proper care and I am sure your physicians need to provide for that care. It is not likely from stones – they cannot find any, and oxalate itself will not cause pain. Regards, Fred Coe
Thank you for your reply, I appreciate it. I had read all kinds of things online about oxalates and from what I read they would account for pretty much all my complaints, so I was worried. I saw a Rheumatologist today and he pretty much said the same thing you did. He said if oxalate crystals were causing issues they would have shown up as kidney stones.
Dear Dr. Coe,
You’ve said that oxalates will not cause pain. However, i respectfully disagree.
The circulation of an oxalate molecule that is ” sharp”, will cut along the blood vessel/vein/artery/capillary amnd in response
Hi Christine, Of course you are the one who can feel your interior sensations, however the oxalate molecule itself is biologically inert in humans and does not have a sharp edge that can damage vessels. Crystals of calcium oxalate can damage vessels but do not occur in people with normal kidney function so far as I know. Regards, Fred Coe
Thanks for the great article! My lab has developed a CHO cell line expressing inducible human SLC26A3. We have very strong induction as demonstrated through western blotting and immunofluorescence. However, we can’t get any indication of oxalate transport by this cell line when induced. We’ve tried chloride -free transport buffer, calcium -free as well, yet no sign of oxalate influx despite trying various concentrations. 1 mM didn’t even show significant passive or active influx. Either we have to work out the transport protocol more, or we are being faced with the unfortunate truth that the human orthologue is not an oxalate transporter. We are about to transfect with a chloride sensitive fluorescent protein to prove the that transporter is functioning. Then we’ll look for oxalate – mediated inhibition. We really wanted this to work so we could start looking for inhibitors, but perhaps SLC26A6 stimulation is our best approach instead. That seems like a much more difficulty undertaking therapeutically though. Any thoughts?
Hi Adam, Very interesting, and perhaps very important for understanding the potential role – or not – of this transporter in humans. I am sharing this comment with my coauthor Hatim Hassan and we will post a more detailed response. Fred
Hi Adam, As I mentioned, my colleague Hatim Hassan reviewed your comment and offers this reply:
“Your findings are not very surprising in view of the previous report that in contrast to the observed robust Cl-HCO3 exchange, human A3 transport oxalate poorly (both uptake and efflux despite using a very high 14C-oxalate concentration of 1 mM) when expressed in Xenopus oocytes (Chernova et al 2003, J Physiol), strongly suggesting that Cl-HCO3 exchange is the main physiological function of A3. Rather than working with human A3, we suggest similarly expressing mouse A3 and show that it is capable of transporting oxalate. Then use the optimized protocol for mouse A3 to see if human A3 can transport oxalate or not. We also suggest assessing Cl-HCO3 exchange by human and/or mouse A3 (we would expect a robust Cl-HCO3 exchange). If necessary, 36Cl uptake (influx) could also be assessed.
Studies in A3 null mice (Freel et al 2013, AJP) demonstrate that A3 plays a critical role in active transcellular intestinal oxalate absorption in native epithelium. If mouse A3 is found not to transport oxalate (or only poorly transports oxalate), then it is possible that the observed reduction in transcellular intestinal oxalate absorption and decreased urinary oxalate secretion in A3 null mice might not be due to the fact that A3 is an oxalate transporter, but rather due to potential loss of a counter-ion gradient (e.g. low intracellular Cl due to loss of Cl-HCO3 exchange in the absence of A3) driving oxalate absorption. Of note is that the situation might be different in native epithelium compared to heterologous expression in CHO cells; however, one would expect at least mouse A3 to show strong oxalate transport capabilities if it is an oxalate transporter.”
I gather he is in accord with your findings and both of you are concluding that this transporter lacks functional relevance in humans.
Thanks for the opportunity to have this discussion, Fred
Thank you very much for the thorough response. Please convey my gratitude to Dr. Hassan. I think his idea about confirming oxalate transport on mouse A3 in our CHO cell system is a great approach to give us more confidence in our finding. I’ve used CHO cells for studying organic anion transporters (OATs), and generally the system works well, but our evidence for human A3 thus far isn’t conclusive without his suggested experiment. Thanks again!
Dear Dr. Coe,
You’ve said that oxalates will not cause pain. However, i respectfully disagree.
The circulation of an oxalate molecule that is ” sharp”, will cut along the blood vessel/vein/artery/capillary and in response, the inflammatory process is triggered. I personally have had bruises for months and many would just show up with no triggering event. Cellulitis was diagnosed one time but i now know that it was related to the bruising easily and the oxalates.
There are so many studies but my own experience has proved the some of the pains were from oxalate. I applied the scientific method by ingesting high oxalate. The pains returned. I repeated several times with the same results. Oxalate molecules cause activation of the inflammasomes. They create cuts and imbed in tissue, infiltrate our cells, which in turn causes an inflammatory response.
I am really disappointed with your statement.
Hi Christine, Oxalate molecules themselves do not activate the inflammasome, it is calcium oxalate crystals. Of course I do not want to in any way appear contradictory, and I have great respect for your own opinions about your health, but this is a public forum and it is my role to be sure that such facts as we have are maintained as best we know them. Regards, Fred Coe
Very informative, thank you for publishing the information and keeping it up to date. My 75-year-old father, an insulin dependent diabetic for 25 years, was recently hospitalized with an acute kidney injury, creatinine of 10. The cause is oxalate nephropathy, as well as underlying diabetes related interstitial fibrosis. He and my mother unknowingly started a very high oxalate, plant-based diet about a year ago, and after the onset of COVID began taking a vitamin C supplement. Looking back at what they were eating the diet contained almost all high oxalate foods and no dairy at all. How I wish he had developed stones rather than renal failure!
Dear Susan, Oh my! Chronic kidney disease of any kind can predispose to oxalate crystallization in the kidneys as happened here. I do hope he recovers some function. My condolences on such an unhappy outcome, yet your parents had no reason to understand what risks they were taking. Fred
My 24 urine test 2 years ago showed an oxalate level of 280 mg (not a typo) and a creatinine level of 1.81. I have reduced my oxalate intake an my most recent 24 urine test showed 26 mg of oxalate and my creatinine has improved to 1,54 and my GFR has improved to 46 with a strict diet, calcium citrate with each meal and a stone buster tablet in the AM. Would reducing my oxalate intake even further help heal my CKD originally caused by my extraordinarily high oxalate intake?
Thanks Steve Frantz
Hi Steve, I am not clear how you got the oxalate so high. Bowel disease comes to mind, primary hyperoxaluria and the second urine value is wrong, an artifact in the first urine. I would do another 24 hour urine with a reliable vendor and see what the urine excretion is. Low GFR and high urine oxalate do not match well with a fall of the latter to 25 mg/d. Something is very wrong with this picture. Regards, Fred Coe