Supersaturations Guide Fluid Prescription
A patient, a physician, both can write down fluid goals. But how do we know the right amount? How do we write the proper fluid prescription for kidney stones?


Indifferently, kidneys supersaturate urine whenever driven to conserve water. With the same indifference, they dilute the urine if confronted with extra water they must eliminate. But we cannot share their indifference. If more fluids protect against stones, frequent voidings disturb our lives and our sleep.
Clearly, the ideal lies between the Scylla of urine supersaturation and the Charybdis of excessive voiding.
How do we navigate between them?
Kidneys Supersaturate Urine By Doing Work
They Filter Lots of Water From Blood and Reabsorb Almost All of it.
Kidneys use the work of the heart to filter a large amount of water out of the blood every day: About 140 liters, or 36.98 gallons.
People in general produce about 1 – 2 liters of urine a day, or 0.26 to 0.52 gallons. So kidneys concentrate the filtrate by 70 to 140 fold. This process of removing the water from the filtrate back into the blood requires energy and does work on the solution. It is identical to the evaporation experiments we have already spoken of elsewhere. Such work produces supersaturation.
Kidneys Filter Salts Out of Blood and Reabsorb Variable Amounts
Some molecules that produce stones, like oxalate, play no useful role in the body and need to be removed. The amount removed depends on how much is produced in the body and absorbed from foods. Others like calcium and phosphate and citrate are conserved by complex biologies as well as by how much is absorbed from foods. Regulated transporters control urine acidity or alkalinity, measured by urine pH; work done on urine to change pH can raise supersaturation.
Stone formers tend as a group to conserve calcium less and citrate more than normal, so for any amount of water the amount of calcium is higher and citrate lower than in normal people. Because citrate binds calcium and inhibits calcium crystal formation the high calcium to citrate ratio in urine of stone formers synergizes with water conservation to raise supersaturation.
Supersaturation Reflects the Proportion Between Reabsorption of Water and Salts
Crudely and incompletely put – there is a lot of complexity here! – people make kidney stones in part because of an imbalance between urine losses of calcium, oxalate, citrate and water. Whether this imbalance arises from genetics, habits, vocation, systemic disease, or chance, it can produce or increase supersaturation.
What We Drink Controls Urine Supersaturation
So far as we know, kidneys pay no heed to urine supersaturation. To prevent dilution of blood sodium they rapidly remove extra water we drink. If we do not drink, they conserve water to protect blood sodium concentration. So we can regulate our own urine volumes by how much we drink. We determine if our kidneys supersaturate urine more, or less, or perhaps even not at all.
Which Supersaturations Matter?
The ones that relate to the crystals in stones formed.
Stone analyses disclose those crystals. Urine supersaturation drove those crystals to form.
Given the common calcium oxalate kidney stones, both calcium oxalate and calcium phosphate supersaturations matter because calcium oxalate grows over an anchor of calcium phosphate on the inner surfaces of renal papillae. Sometimes, calcium oxalate kidney stones form on the ends of calcium phosphate plugs in the terminal portions of the kidney’s tubules – where the final urine leaves the kidneys. Either way, some calcium phosphate crystals must form that calcium oxalate can anchor on.
For calcium phosphate kidney stones, calcium phosphate supersaturation matters most. Sometimes stones contain both crystals, and both supersaturations may matter.
Given this logic, calcium phosphate supersaturation always matters.
For uric acid or cystine stones, those supersaturations most matter.
What We Cannot Consider Here
Here we consider only the two calcium stones, leaving uric acid and cystine for another time. Likewise, we restrict ourselves to stone formers without a systemic disease as a cause of stones. Systemic diseases pose their own special problems.
Some patients who form stones have diseases that do not cause stones but reduce the safety of high fluids. Heart failure, chronic kidney or liver disease, malignant tumors all may limit fluids. Likewise medications such as diuretics, psychoactive drugs, and more may matter. Only physicians can manage these complexities.
Fluid Prescription Varies Over the Day
The Big Picture
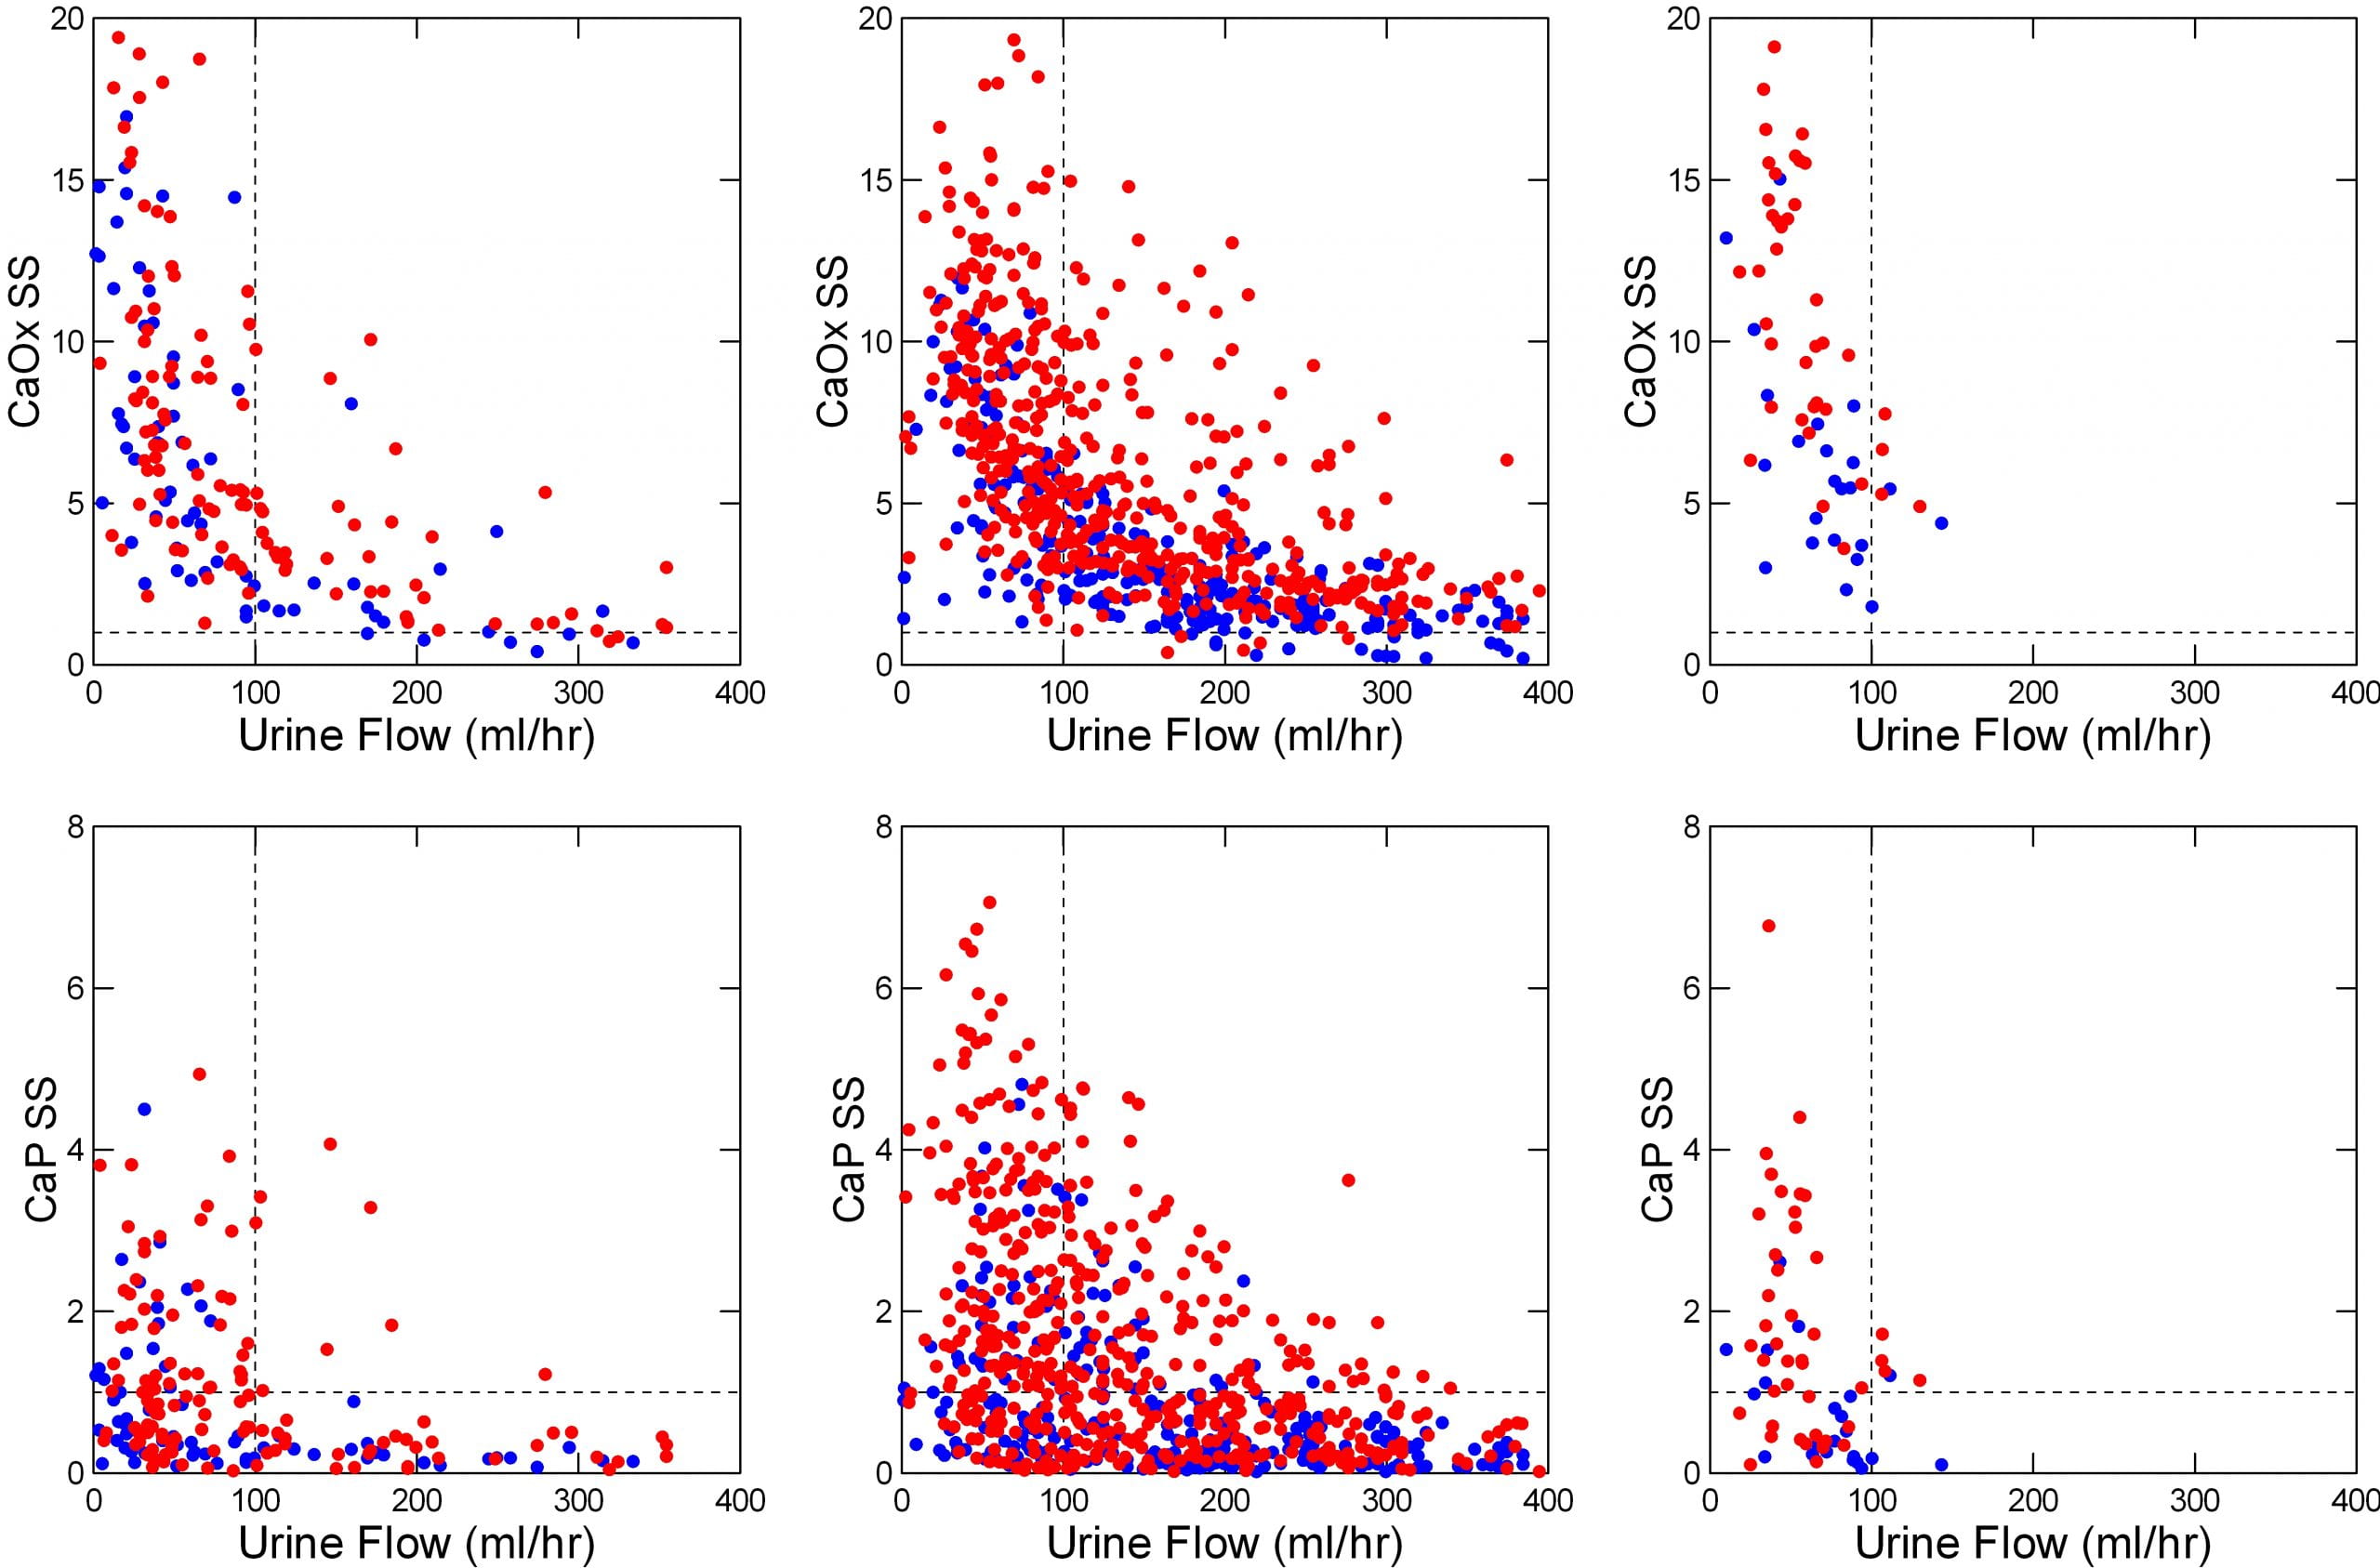
The featured image at the top of the post tells the story for calcium oxalate and calcium phosphate.
It shows urine supersaturations along the vertical axes as ratios. Values for calcium oxalate lie on the top row, those for calcium phosphate on the lower row. At the solubility point (dashed horizontal line at 1) crystals neither form nor grow. Below 1 (undersaturated) more could dissolve. Above 1, supersaturation, crystals can form and grow.
The urine flow rate runs horizontally along the bottom axis. It’s units are milliliters per hour; 1000 milliliters make up a standard 1 liter water bottle. A liter is 33.8 ounces, just slightly more than a quart (32 ounces). So 100 milliliters (where we put the dashed upright line) would be 1/10 liter, or about 3.4 ounces per hour of urine flow. That would be 2.4 liters (or quarts) a day.
What Are Our Supersaturation Goals?
Obviously, supersaturation falls as urine volume goes up. We expect that. But how low, and why?
We Have No Trials
Because of crystal modulating molecules in urine and the complexity of how crystals actually form no supersaturation must be ‘safe’ except if below 1. We can hardly ever lower calcium oxalate supersaturation that low, and only sometimes do so for calcium phosphate. So we need some usable principle or maxim, and articulated one in another article.
The Principle or Maxim
If new stones are forming, supersaturations of urine samples obtained under conditions that reflect everyday life are too high in relation to crystals in stones forming. Dr. John Asplin offers lowering it by half. Crudely put, this makes an average goal around 4 or 5 or less for calcium oxalate, and about 1 or less for calcium phosphate, given the average levels of supersaturation observed before treatment.
Fluids Over the Day
Fasting
The left panels of the featured image show kidney stone formers (red) and normal people (blue) before breakfast, which means fasting since the night before.
Almost all the urine samples are supersaturated with respect to calcium oxalate (upper panel; most of the points are above the horizontal dashed line at 1). Below 100 ml/hr (3.4 ounces/hour) supersaturations rise steeply.
By contrast, many of the urines are undersaturated (below the dashed line at 1) with respect to calcium phosphate (lower left panel). Even so, below 100 ml/minute, the percentage rises steeply.
Stone formers (red points) have higher supersaturations than normal people (blue points) for the reasons we already mentioned: They tend to lose more calcium, or oxalate, or less citrate in their urines than normal people, so for any amount of urine their supersaturations are higher.
The fluid prescription: Keep urine flow above 3.4 ounces an hour between arising and breakfast.
As noted in the review of the Pak experiment (below), the difference between 24 hour urine volume and actual fluid intake is about 0.9 liters (900 milliliters), or 37.5 milliliters (1.1 ounces) per hour. Rounding, to avoid confusion, we need 3 – 4 ounces of urine or 4 – 5 ounces of fluids an hour.
Fed
Urine calcium losses, especially, but also losses of oxalate rise more with meals in stone formers than in normal people, which creates a need for even more water than is needed while fasting. The middle panels show the consequences. It takes roughly 125 ml/hour (4.25 ounces/hour) to keep supersaturations below 1 for calcium phosphate and below 5 or so for calcium oxalate. Given the extrarenal water losses mentioned above of about an ounce an hour, this comes to 4.25 + 1 ounces an hour, or about 5.25 ounces an hour.
Fortunately we tend to drink while eating. The graphs make clear that lots of people were drinking even 10 ounces of fluids per hour.
Overnight
Like the other periods, urine flows below 100 ml/hr (3.4 ounces/hour) produce a steep rise of supersaturations (right upper and lower panels). Although urine calcium losses fall over night, they do so less in patients than in normal people. So we need about 5 ounces per hour.
The Grand Total
People all live their own lives and many, perhaps most, deviate from the food schedule we used for this research. So we can total up all the fluids needed in our study as an example, but expect people will modify it to their needs.
Given fasting of 2 hours, at 5 ounces an hour (10.5 ounces (0.3 liter) total), fed of 14 hours from first meal to bedtime, we need 14 * 5.25 = 73 ounces (2.1 liters) total.
Overnight, 8 hours, at 5 ounces an hour, 40 ounces (1.2 liters) total.
Altogether this makes 123 ounces (3.6 liters) of fluid intake a day in this example. One can calculate for the fasting, fed, and overnight periods of a patient to obtain a more refined estimate.
Urine Volume Effects In 24 Hour Urines
Up to now our data have come from subjects all eating the same foods in a clinical research unit. What about the street? How do things look if we use just 24 hour urines collected with no control of anything – diet, fluids, behavior? From our own clinic and from many practices that used Litholink in its early days, we collected 24 hour urine samples that answer the question.
 How We Plotted the Results
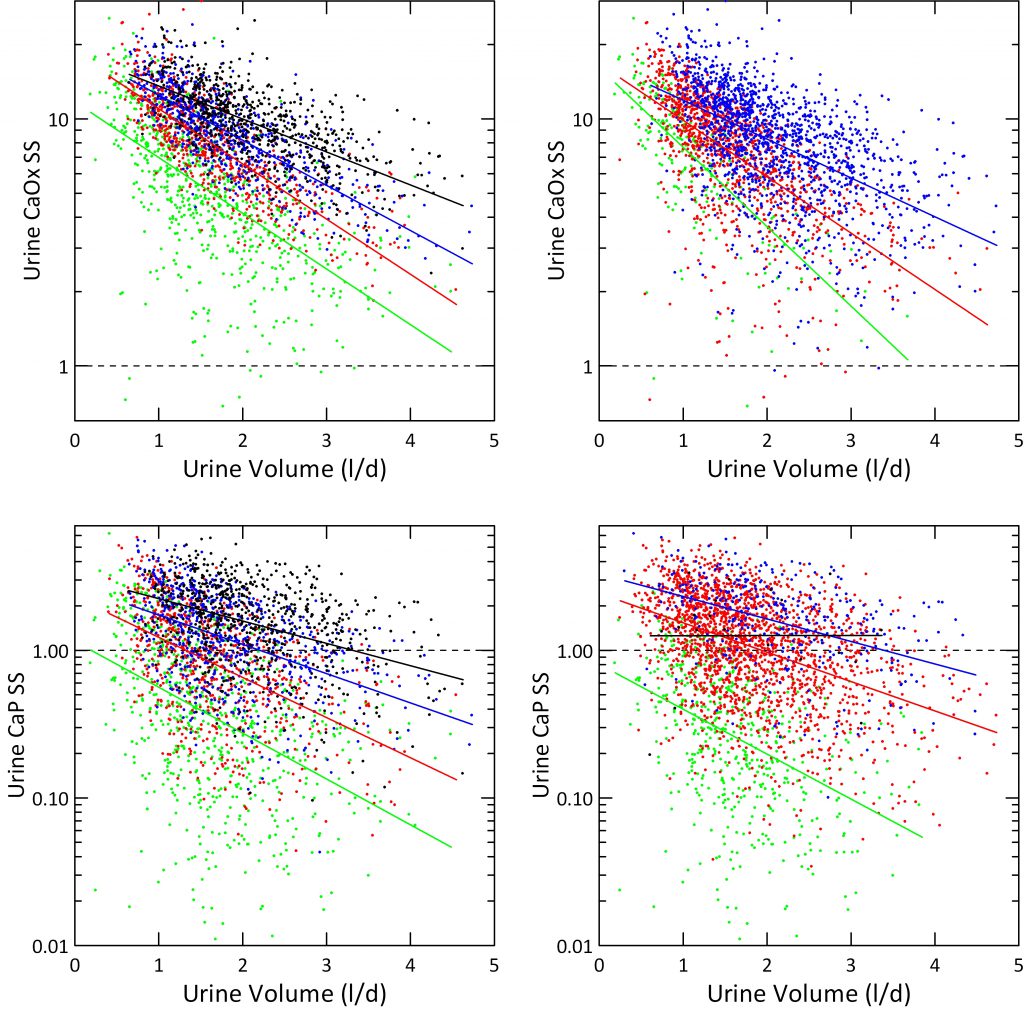
For the left hand panels, we divided urine calcium into quartiles (mg/d): <144 (green), 145-216 (red), 216-301 (blue) and >301 (black) and plotted SS on a log scale to accommodate the wide range of values. We overplotted simple linear regression lines on the four separate color bands to show slopes.
Just as for hourly collections in the Clinical Research Center, and despite no control of diet, SS for CaOx varies strongly with urine volume (upper left panel). CaP SS lower left panel) correlated less well because more dependent on urine pH.
Effects of Urine Calcium
SS for CaOx and CaP varied with the quartile of urine calcium enough that the four color bands separate visually despite some overlap. The lowest quartile fits well with average urine calcium of normal people. The blue and black quartiles represent urine calcium levels associated with increased risk of kidney stones.
The four ascending urine calcium quartiles form a set of ascending ramps, so at any one volume SS rises as you climb up from one ramp to the next.
Effects of Urine Oxalate
We divided urine oxalate excretion into tertiles that roughly spanned the main stone risk regions derived by Curhan: <25, 25 – 40 and >40 mg/d. Calcium oxalate supersaturation rose markedly with rising urine oxalate quartile (upper right panel), as expected. We do not show effects of urine oxalate on CaP supersaturation because it should be and in fact is irrelevant – no effect.
Effects of Urine pH on CaP Supersaturation
Instead, we plotted CaP supersaturation against urine volume, in the lower right panel, and graphed it by four levels of urine pH: <5.5, 5.5-6.5, 6.5-7.5, and >7.5. At the lowest pH, in green almost no urine volume is low enough to create a supersaturation above 1. When pH rises above 7.5, supersaturation exceeds 1 no matter how high the urine volume. So the regression line is horizontal.
Fluid Prescription
Although the lines for the four quartiles have different slopes, one gets about 50% lowering for a one liter increase of volume for the two middle quartiles.
The urine volume our fluid prescription should produce, about 2.5 liters daily, should lower CaP SS below 1 for most patients in the lower three calcium quartiles. Likewise it will lower CaOx SS below 5 in the two lower calcium quartiles Given corrections for insensible losses this comes to about 3 liters of fluid intake, a result much like we got from the clinical research unit data.
But our data offer a warning. When urine pH is high, CaP supersaturation will not yield to volume. More must be done.
Urine Calcium Effects In 24 Hour Urines
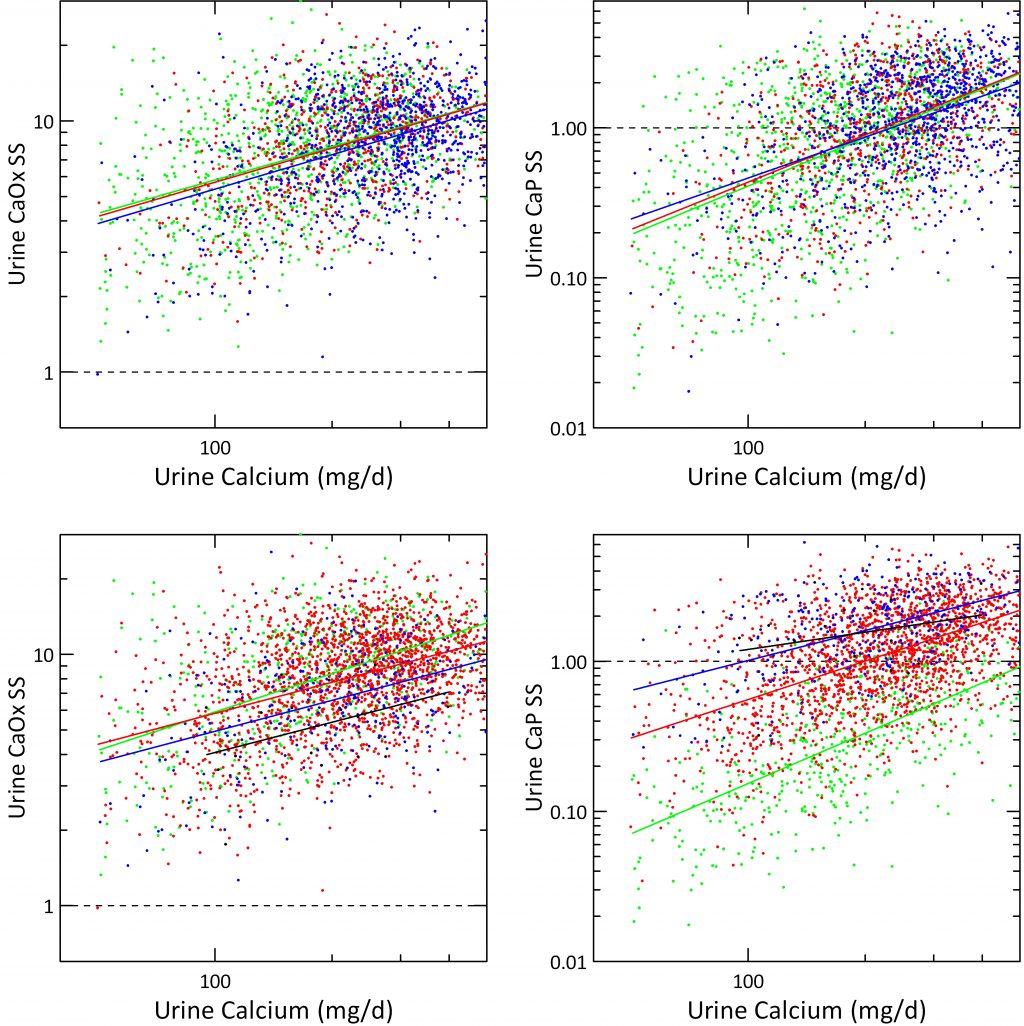
Urine calcium exerts a powerful effect on stone risk in the Curhan data. It also raises both CaOx and CaP supersaturations as was obvious from the prior graph. But what about urine citrate, and urine pH once calcium is itself accounted for?
Urine Citrate
When supersaturations for CaOx and CaP are plotted against urine calcium the three grades of urine citrate we derived from the Curhan data (mg/d) <400, 400 – 600 and >600 had almost no effect; the three regression lines hardly separate.
We are surprised a bit in that calcium binding by citrate might have been expected to alter supersaturations more than this. Probably what the graphs really suggest is that urine citrate works mainly by affecting crystal formation, not simply via supersaturation reduction.
Urine pH
Over same quartiles we used in the prior graph just above this one, urine CaOx SS fell remarkably as pH reached the top two – >6.5 in blue and >7.5 for the black line. This is shown in the lower left hand panel. As expected from what we already showed you in the volume plots, CaP supersaturation is almost unaffected by urine calcium excretion and fixed above 1 at the highest urine pH – black line, and almost always below 1 at the lowest pH – green line.
Value of Multiple Treatment Modalities
These data, from all sources, show why multiple treatment modalities work better than dependence upon only one. For example, lower diet sodium can lower urine calcium so a patient moves from a higher to a lower calcium quartile and therefore a lower urine SS at any given urine volume. More urine citrate or less urine oxalate excretion will do the same. Changing urine pH or urine oxalate, will also matter.
We did not produce all possible plots but high calcium diet that lowered urine oxalate would equally create a range of bands like those for calcium, and the same for changes in urine citrate.
A Direct Experiment
In 1980 Pak and Sakhaee varied urine volume in people and measured resulting saturations. They also related fluid intake to the resulting urine volume. This gave the 0.9 ;/day correction we used in our fluid prescription calculations.
What They Found
They incubated samples of urine with an excess of the solid phases – calcium oxalate, and calcium phosphate in the form of brushite – so as to bring the sample to t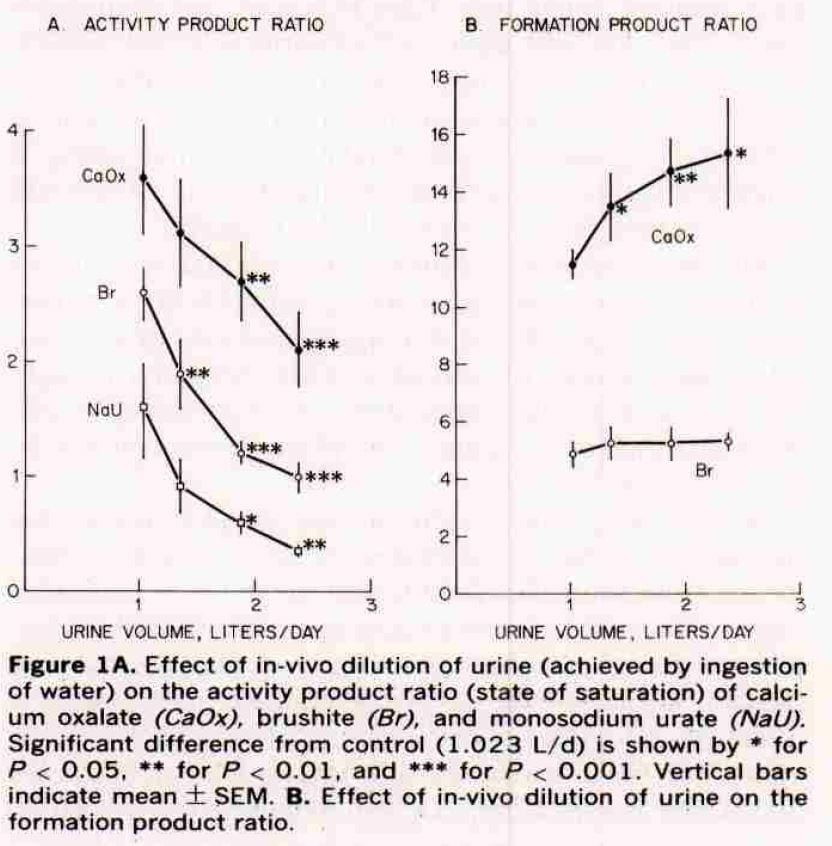 he solubility point. The ratio of the product of the calcium and oxalate ion activities (calcium oxalate) or calcium and hydrogen phosphate activities (brushite) before to that after the incubation is supersaturation.
They called this ratio the activity product ratio, or APR. EQUIL calculates the ratio of the salt (CaOx or CaP) in urine to its solubility and correlates directly with the APR but a plot of our SS against APR has a slope greater than one. So at solubility both would be 1, but as APR rose the SS we calculate would rise faster.
Effects on Saturation
As they increased urine volume in their subjects (left panel of their figure), supersaturation fell for CaOx and brushite. We do not consider sodium hydrogen urate here, and ignore those points.
At about 2.5 liters, that for calcium phosphate (Br) fell to solubility (the line at 1) and that for calcium oxalate (CaOx) to about 2. The stars give estimates of the significance of the fall. Our average calculated SS for CaOx were about 5 at that volume. GIven the scaling differences between APR and EQUIL SS, this would be about a value of 5 as we found. For CaP, like them, we found most values below 1 (see the previous figure).
Formation Products
Our detailed review of supersaturation presents three zones: undersaturated; metastable supersaturation – like most urine; and unstable supersaturation – where crystals are forming and the energy of the solution is running down. The formation product ratio is the activity product ratio (their estimate of supersaturation) at which the urines they studied enter the unstable zone.
For calcium phosphate that zone is about 4 – 5 and is unaffected by volume. For calcium oxalate it is a lot higher, and rises with water. So the protective effect of diluting the urine seems greater for calcium oxalate: the floor – saturation – goes down while the ceiling – formation product – goes up.
Their formation products are the Ostwald limits written about elsewhere.
How Much Do We Drink?
They found that 1.8 liters of intake gave 1.02 liters of urine; 2.3 liters gave 1.35 liters of urine; 2.8 liters gave 1.88 liters of urine and 3.3 liters gave 2.38 liters of urine, Differences between intake and urine of 0.78, 0.95, 0.92, and 0.92 liters/day. This means that to get the highest protection they observed, we would need 3.3 liters (112 ounces) of fluid a day, a value close to that from our CRC and 24 hour data.
The Fluid Prescription for Kidney Stones
A Standard Estimate
Because we have no trials, we cannot say that calculations based on our data will yield better results than just an overall 24 hour goal of above 2.25 liters that Curhan found at the threshold of kidney stone risk. But there seems no risk to doing the simple arithmetic: 100 ml/hour fasting and overnight, 125 ml.hour from breakfast to bedtime. This would be a kind of standard estimate which can be varied depending on the circumstances. Overall, this value would be about 3 – 3.5 liters daily.
Alternative Estimates of Supersaturation Goals
We have already pointed out that because of the many crystallization modifying proteins in urine one cannot say a particular supersaturation is ‘low enough’ in general. Many normal people have high urine supersaturations as in the 24 hour urine and featured graph, but do not form stones. Very many stone formers have urine supersaturations that overlap with those of normal people.
Activity of Stone Formation
For this reason, we have proposed on this site that the supersaturation of an active stone former is too high. Active means that new stones are forming as opposed to passage of stones what were present in the kidneys in the past. A reasonable goal is to lower the supersaturation by half regardless of its absolute value.
Using this criterion, many people on our graphs would need more fluids. For example, those with supersaturations of less than 10 for calcium oxalate who were actively forming stones would have to lower that supersaturation well below 5. This could require more fluids than in our standard estimate.
Other Treatments Beside Fluids
Throughout we have calculated as though we lowered supersaturation only by increasing urine volume. But of course we use other treatments that may reduce the need for fluids.
Such treatments lower urine calcium or oxalate, or raise urine citrate.
Even so, because fluids safely reverse the renal process that supersaturates urine, they have about them as a treatment what we might call elegance – a simple and effective means of accomplishing a goal.
Other Worlds
The value of 0.9 liters for daily non-renal fluid losses does not apply everywhere. People live in deserts. Some build buildings outdoors in summertime, work in kitchens or in foundries. Think about workout enthusiasts, professional athletes. All of these people need more fluids than we calculate. Even the seasons matter, and sex, too. Men lower their urine volumes and raise supersaturations greatly in summer time, women do not.
HOW TO USE OUR OTHER POSTS ON FLUIDS
We have offered several posts on tricks for drinking more fluids, and how to make good choices of beverages. The goal volumes for these posts exceed those offered here. We made them generous just because many people may need very high fluid intakes. Consider them recipes for a large party one can scale back as needed.
Return to Walking Tour on Supersaturation
Tx for the info. I drink gallons of water. And still get stones at least one a year. Usually February. Regards joe
Dear Joe,
Fluids are the basic treatment but certainly not the only treatment. They come first because fluids are so safe, and can be effective. There exist other treatments that one adds to fluids so that stones do not come every year. The site will gradually cover them. Regards, Fred Coe
Esteemed Dr/s: About the determination of the relation between urine creatinine excretion and body weight, which weight do you consider: the current weight or the lean muscular mass.?
And thank you for the opportunity to consult with you. It’s fascinating, almost impossible in other times. Thank you very much Dr. Coe and colleagues
Dear Dr. Mateo, I apologize for this delayed answer. It is my practice to factor the urine creatinine by the actual body weight in order to estimate the degree of obesity. Values for men under 20 and for women under 18 suggest excessive body fat. I do not use another estimate for muscle weight apart from urine creatinine excretion itself. Regards, Fred Coe
Boil barley .grind it in a juicer .filter the liquid.add honey .drink
Hi Gulam, I guess this is meant as a nice beverage – you make no medical claims for it except that if it tastes good people will drink it. Regards, Fred Coe
please with kidney stone now, what amount of water should I be taking daily to get the stones flushed off my system
Hi Justin, There is no evidence that high fluids will increase rate of stone passage. For prevention you want between 2.5 and 3 liters of fluids daily, long term, too. Regards, Fred Coe
Hi Dr Coe,
For a patient with chronic dehydration 2nd chronic diarrhea (ex. previous colectomy + small bowel resection) with low urine volume and low 24h urine sodium, beside the management of 2nd hypocitraturia and hyperoxalaturia, do you recommend fluid + sodium repletion or only fluid repletion ? If you recommend fluid + sodium repletion, what kind of hydration drink do you recommend? Or maybe Sodium bicarbonate supplements could be added + regular fluid/water hydration?
Thanks a lot for this great website
Hello Dr Levallois, For patients with very low urine sodium because of sodium bicarbonate losses in diarrhea I do indeed use sodium alkali replacement as you suggests. Sodium bicarbonate tablets are inexpensive in the US and an ideal replacement. Some have potassium losses, as well, so potassium and sodium replacement may be needed. Drinks thata contain glucose are helpful as sodium glucose cotransport facilitate water absorption. Thanks for the excellent comment, Regards, Fred
Hi Dr Coe! Thanks for your answer. Have you ever considered prescribing weekly outpatient IV saline hydration for a patient with recurrent kidney stones caused by chronic diarrhea (2nd bowel resection/inflammatory bowel disease) and persistent chronic dehydration with low 24h urine sodium despite increasing fluid intake and Sodium Bicarbonate/K Citrate supplements?
Hi Doctor, I have indeed done this a few times. It was not for small bowel cases but for a few patients who lived in a dark cycle of vomiting and dehydration from stone passage attacks. The dehydration was protracted and seemed to lead to new stone formation, so I used home IVs as a way out. For the small bowel, sodium depleted, low volume patients I have never used home IVs. I rely on the nutrition folks and, like you, on sodium bicarbonate. GLucose drinks help promote water absorption, and I always try them. If you do home IVs and they work, let me know. Warm Regards, Fred
Hi Dr Coe,
I had two patients for which outpatient IV hydration seemed to help with they kidney stones:
First patient was a woman with metastatic pancreatic cancer. She initially had Whipple Procedure complicated by chronic diarrhea, enteric hyperoxaluria and hypocitraturia and Dumping syndrome (which made low oxalate diet and fluid hydration difficult). She had severe bilateral recurrent kidney stones and secondary CKD, with multiple kidney stent procedures. With daily IV hydration (1L half-saline per day) using a Port-a-cath, I was able to keep away from dialysis for a year or so. She still needed regular kidney stents and eventually a nephrostomy, but urologist told me he saw a big difference when we started regular IV hydration.
Second patient was a man with Crohn disease, with history of subtotal colectomy and ileorectal anastomosis. He had chronic diarrhea and chronic low urine volume, low urine sodium and hypocitraturia and recurrent kidney stones (Ammonium Acid Urate Crystal) despite fluid hydration and K-Citrate supplements. He also had mild CKD with left kidney atrophy 2nd kidney stones and chronic dehydration. Initially, I prescribed IV hydration 1L NS q week at outpatient clinic which seemed to be successful since he stopped having symptomatic kidney stones. His gastroenterologist was eventually able to control his Crohn disease with biological treatment and he was able to stop regular IV hydration.
Best Regards,
Jasmin L.
Hi Jasmin, Thank you for sharing these cases. I do not have equivalent experience with this kind of hydration but it seems successful in your patients. Regards, Fred
Can you possibly suggest any practical rule-of-thumb to estimate how much increasing my urine volume during a 24 hour urine test, by say 25%, would have improved my CaOx and CaP supersaturations in that test?
Based on what I understood from this helpful article, it seems more complicated than just reducing them by 25%. Thx!
Hi Kenny, You are right, it is complicated. Since calcium oxalate SS, for example, is roughly the product of calcium times oxalate concentrations – I am over simplifying a lot!! – one would think SS would fall as the square of the volume, but as ionic strength falls the activity coefficients of both increase. As a result the actual relationship depends on the whole mixture. Even so, doubling urine volume will sort of lower SS by a lot – maybe in the final case – by half or so. Regards and thanks for a really good question, Fred Coe
Thank you! While we’re at it…I know dark urine is bad. But can my supersaturations vary all over the ballpark even if it is the same pale yellow day after day? (I suspect the compounds that matter to stone formers may not add detectable color of its own or reliably follow excretion of the yellow urochrome.)
Hi Kenny, You cannot tell easily from color alone. Not a good plan. Sorry. Regards, Fred Coe
my urologist has been telling me for years…”dilution is the solution”
that my urine should be light yellow or clear all the time no matter i eat or vitamins i take..
i try to follow those rules..but when i slack off…i get stones..
in 40 yrs ive had 8 of them…4 in the last 4 years because i turned vegan… im eating all high oxalate foods now…..stones suck.
Hi Theodore, You did not mention the composition of your stones; were they in fact calcium oxalate as determined in a laboratory? If you form so many stones now unless urine volume is very high I presume your urine chemistries are abnormal. I would be sure the causes of your stones have been sought. Here is a good plan to follow. Regards, Fred Coe
Hi Dr. Coe,
Thank you for this very interesting and helpful article!
I’m trying to measure Ca excretion through the day with my actual diet. I’ve got an aquarium test kit (two reagents-add drops of the 2nd until the indicator changes from pink to blue, as opposed to one the uses a continuous color chart). Results seem reasonably repeatable.
The problem is that when I test a 24 hour collection before sending it to Litholink, I get about a 50% higher value for Ca/liter*volume than they get for Ca 24 than they do even when averaging multiple tries. I expected that both would be measuring essentially the same thing. So I’m puzzled. Any ideas?
Best regards, Al
Hi Al, You measure concentration, they daily excretion. If you calculate concentration from their urine calcium excretion and urine volume it will be the 24 hour average. This cannot correlate with your spot measurements. Regards, Fred Coe
Hi Dr. Coe,
Thank you for your help! I agree with that, but maybe I wasn’t clear. Pls let me try one more time…
The problem surfaced while I was simply attempting to verify/calibrate the test kit by comparing to Litholink as a trusted standard. This is before I attempt a completely different kind experiment.
Example: Say I have a 3 liter, 24 hour collection. I test it before sending to Litholink, and the test kit says the average for the day is 150 mg/liter.
But Litholink reports Ca 24 of 300 mg for the same 3 liter specimen, and that is a daily average of only 100 mg/liter.
I thought these would be measuring the same Ca, but the results aren’t even in the same ballpark. Not sure what to make of this. Best regards, Al
Hi Al, If your kit says 150 mg/liter and the volume is 3 liters then the 24 hour amount is 3 times 150 or 450 mg. If Litholink finds 300 mg in the 3 liters the true concentration is 100 mg/liter. The Litholink method is correct – it is very well qualified as correct, so the kit is not accurate. This latter is not a surprise. Measurement of urine calcium can be difficult. Regards, Fred Coe
My question is in regards to the calcium content of the particularly hard water in the Midwest, evident by extreme limescale buildup in our water pipes and appliances. We who live near Lake Michigan have always heard that the secret to kidney stone prevention is to “drink the lake” , but would this water not have a similar effect as to build-up in the “pipes” of a person prone to making stones? Has any research been done with regard to water quality?
Hi Jo,The calcium in water is not important. You need 1,000 to 1,200 mg of calcium daily – everyone does – and perhaps the water provides 100 mg at most. Whatever else is in water, magnesium, for example, has no stone effects. Regards, Fred Coe
Hi! I recently passed a 6mm stone (hasn’t been analyzed yet, but it looks like calcium oxalate and my Dr. recommended drinking 2-3L water and also Crystal Light) that led to the discovery of a 2cm stone in the same kidney that one came from. I drink 10 cups of water + 2 cups of milk daily, which I considered a lot of liquid intake, but I only do this because I breastfeed. I’ve been breastfeeding for 5 years off and on (12+ months consecutively per child) because we’ve had 4 kids very close together, and I’m now wondering if this has led to or contributed to kidney stone formation. Do you have any thoughts on this? Also, considering that I am exclusively breastfeeding a 4-month-old and trying to prevent more stones, is 3-3.5L enough for me? I was already drinking roughly 2.8L of liquid a day, 2.4 being water. Thanks in advance!
Hi Brittany, While breastfeeding you have no choices but as much fluid as is needed to maintain a high urine flow. Afterwards, you should get fully evaluated to find out why you make stones and get proper prevention. Multiple pregnancies do not cause stones unless other things are wrong that promote stones, and I suspect you have one or more of them. Right now, high fluids and later on do the evaluation and get definitive prevention. Regards, Fred Coe
Thank you!
Hi,
I’m wondering about chia seeds. I can’t seem to find any solid info on them. They have so many health benefits I’m thinking I’d like to add them to my list of foods to eat, but — and in what amount. Any info would be greatly appreciated. Thanks.
Fern
Hi Fern,
I have read that they are on the low side, but please don’t overeat them. Sprinkle them gingerly where you would like them. Problem is so many people are here because they overate healthy items. Overeating, even healthy foods, are not a good idea.
Thanks for writing,
Jill
Have had 7 to 8 kidney stones in the past. Analysis shows they are CaOx stones. Is 4 liters of water per day too much? Sometimes drink 3 liters in 7 hours. Obviously, producing lots of dilute urine. Last liter over maybe 3 hour period. Too much? H/O hypertension controlled with Losartan. Thanks.
Hi Kathleen, Fluids are good but never the complete answer. You need to figure out what is causing stones and treat whatever that may be. See if this article is any help. you need the right diet and maybe more. Regards, Fred Coe
I have nephrocalcinosis and have had MANY surgeries to remove larger stones. I pass stones regularly ranging from 4mm to 10mm. On your site you have information on diets and that they can help but obviously not cure. I take potassium citrate 2 x day, drink a TON of water with lemon and eat a healthy diet. Any suggestions??
Hi Emily, Sounds like you have inadequate prevention and that reliance on potassium citrate and water has gotten you less than you need. Here is a better approach. See if it help you think about your situation. Regards, Fred Coe
Dr. Coe,
I have a kidney stone. I am impressed with your research, however I would appriciate hearing your thoughts on a comment in a urine analysis report from ARUP in Salt Lake City.
The report has an entry showing a very strong linear correlation between calcium intake and urine calcium, yet your research shows that sodium has the strongest affect on calcium in urine.
Is there a reason for the disparity?
Thanks
Hi Stephen, I am sure that urine calcium will vary with diet calcium, and I have shown the data as are available that urine calcium is a function of urine sodium. But the system is complex because absorption of diet calcium is regulated by vitamin D and bone mineral balance by the combine of diet calcium and diet sodium. Sodium acts mainly – not only – on kidney calcium handling, so if one raises diet calcium a lot and also lowers diet sodium urine calcium will hardly rise at all. Take a look at the Borghi trial data in this link. Low sodium – 123 mEq/d + 1200 mg a day calcium gave a urine calcium of 5.9 mmol/d whereas a 400 mg calcium diet + 200 mEq/d of sodium gave a urine calcium the same- 6.2 mmol/d. In other words 3 fold increase of diet calcium with about a halving of diet sodium led to equal urine calcium values. Regards, Fred Coe
Dr. Coe,
Thank You for your response. I have taken 20 urine analysis that I found on-line and done some data analysis to determine the underlying equation governing supersaturation from the urinary test values. These are the values of supersaturation as calculated from what I believe is the Equil2 program. I need more urinary test data at higher fluid volumes, so that I don’t need to extrapolate to these higher fluid volumes. At the top of this web site you show some SS data at fluid volumes as high as 400 ml/Hr. Can you send me some sample, high volume analysis, or point me in a direction were I can find some?
Hi, I presume you are a researcher, and quite possibly a mathematician, so I can understand the interest. I also presume you are working on an alternative equation set for testing. If you need data for such purposes, you would best contact me directly, via email, and we, our universities, and my research colleagues can work out with you how we can help setting up data sharing. Regards, Fred
I’m not a researcher. I’m an Engineer and do some data analysis as part of my job, with perhaps some unique insights. I have a stone and before considering further intervention, I have been looking at the possibility of dissolution. The graphs showing SS at the top of this web site show many SS values that are well below one at higher fluid volumes, with some values close to zero. It would help me greatly, in my data analysis, and understanding, if I could get a handful of high fluid volume, low SS, urine test results. Anything you can offer would be greatly appreciated. I have reviewed many papers on this subject from researchers. You probably know better than anyone the complexity of this subject, and human biology. I have enjoyed reading your take on this subject, and particulary like this web site.
Hi Steve, Dissolving calcium oxalate stones is not a likely prospect. The crystals are embedded in protein matrices, and of course stones are large with low surface/volume ratios. While SS values below 1 can be obtained for a time, variations during the day can lead to growth – dissolution cycles. More importantly, none of us ever see CaOx stones dissolve. Hydroxyapatite stones are unlikely to dissolve – the salt has a very low solubility. Uric acid stones do dissolve, readily. Do you know what your stones are?? CT density units can help – low ones suggest uric acid. Regards, Fred
Dr. Coe,
I haven’t had a stones before, so I have never had a stone analysed. The stone is radiopaque so my guess is CaOX or CaPh. My diet was a typical US diet, which I would guess would lead to an acidic urine, so perhaps CaOx is more likely. I am now following th etype of diet you dicuss and recommend (high H20 intake, sufficent Ca, low Ox, goal of 1000 mg sodium, low protein with fruits and veggies, Kcit suppliment). I have probably reviewed 100 papers on CaOx & CaPh stones and unfortunately for me, I do understand the reality of the situation, and unlikely ability to be able to dissolve a CaOx stones. Although this hasn’t deterd my desire to understand the factors affecting SS. I don’t know if the organic matrix that you discuss is a bigger or smaller problem, as compared to CaOx disolution. It would also be interesting to understand if dissolution of the organic matrix, could be a simpler avenue to dissolve the stone. I’m actually a bit surprised that epidemiology studies haven’t given more clues about this complex aspect of stones. My initial cut at analysing the multiple urine analysis reports has shown a saturation curve for CaOx vs. fluid similar to the curves you show above in this web site. Although, I used a power curve instead of your logrithmic representation, (which is your linear line on your semi-log graph). I did this because the underlying chemistry that determines saturation as the multiple of Ca and Ox concentrations. Interestingly, the data shows that the power curve isn’t exactly to the 2 power, but is closer to 1.45, and slightly variable with fluid quantity. My guess is that this small correction is due to the diverse ion effect of the other anions and cations in the urine ( K, Mg, Cit, Cl, PO4, etc). The Power curve representation is similar to your data, but as you may expect , slightly more pessimistic. You can even determine a simple saturation value from a given situation of urine values, which is interesting. This is a simpler construct than the method use in the EQUIL2 program, which is more sophisticated as it looks at many potential precipitants. My analysis would be better, with less of an extrapolation if I had more urine data particularly at higher fluid volumes with low SS values. I will probably look for more of this data in on-line searches
Hi Steve, for your care, the diet is a good thing as it has had one good trial and worked. Dissolution is not a real prospect but you are skilled and may find a way. You are right about the deviation from a simple power curve arising from ionic interactions. As for the matrix, too messy right now. At least 1800 separate peptides in urine, stones take up hundreds and many are well known to affect crystals. I spent a lot of time and money – your money – trying some years back, and we took another pass a few years ago with some sophisticated proteomic people, still nothing. Regards, Fred
How common is it to bleed after urination when having or passing a kidney stone? I had a small kidney stone in my right kidney which made my kidney swell and my Urologist even though its a small kidney on the CT scan its in a bad place for passing easily. So I have blood, quite a bit of it after each time I urinate. It seems like this is slightly better the more H20 I drink. I didn’t realize how much water we actually needed to drink a day I’ve been WAY under. I’m lucky to get a 1.5 liter per days thats with heavy caffeine and coffee daily as well has very intense daily workouts where I’m literally sweating through the clothes I’m wearing and not to mention being a firefighter and sweating with the normal daily routine of that. I had a 3mm stone right kidney which as of right now I think has moved into the ureter which is now causing me a lot of symptoms like painful, burning urination and blood after urination. I’m on Flomax qhs and Doxy BID and I’m currently pounding the water because I’m so far behind my urine is like coke.
Hi Chad, a stone that caused a kidney to swell was causing obstruction. The bleeding is not at all surprising. Your urologist is responsible for assuring this stone passes, so be sure and do exactly as S/He says. You are a brave and valuable person who saves people from death, so take of yourself, and accept the gratitude of the world for doing such a noble occupation. Regards, Fred
Hello Dr. Coe,
Does coffee (regular or decaf) make the urine more acidic or alkaline?
Many Thanks.
Hi Diane, Not appreciably that I know of. Regards, Fred Coe
Dear Dr. Coe,
First, I want to express my gratitude for your compassion and generosity in consolidating so much critical information for us laypeople, complete with eccentric amusements, little asides, and gorgeous art. You show such patience and kindness in your responses to the emails. You truly are a remarkable person.
My question is about fluid intake for a 120 pound female with one kidney. I now keep my sodium at the eve you recommend, virtually zero oxylates – whereas prior to last Fall, I was an acolyte of the keto almond-and cassava flour and chocolate craze of the past ten years.
I have not been able to find any recommendations for fluid intake where there is one kidney. I am concerned I may be drowning my right kidney, or putting too much pressure on it with so much fluid – I take in about 3 liters per day. Is this even a possibility?
For background, I have had calcium oxalate kidney stones since I was 24 years old, but was never told they could actually damage the kidney – only that they would pass, which they always did without much fanfare other than screams of pain every few years.
Two months ago my left kidney was removed due to a very large cal-ox stone that was lodged at the top of my left ureter, just above a kink in the ureter. The stone was estimated to have been snowballing there for over a decade, eventually choking my poor kidney to the point that it was no longer viable. No symptoms.
I am now about to go in for surgery to remove a large staghorn from my right kidney and innumerable small stones. My right kidney is very enlarged, but according to tests is functioning pretty well considering the blockage. Also no symptoms.
I want to treat my right kidney with as much care as possible, and would love to know if there are any special considerations in this situation.
Thank you!
Hi Elena, One kidney and a staghorn stone is not ideal but if your surgeon is skilled – as is usual with stone surgeons – things should be alright. The problem is prevention and you mention nothing about serum and 24 hour urine testing – what was found to cause your stones? Very large calcium oxalate stones are not the rule, so why do you form them? To me you are a prevention challenge, and prevention aims at cause. Here is my best on complete evaluation, and what to do about what is found. Best, and thanks for the so well written complement. Fred