
Long ago, physicians gave calcium kidney stone formers oral phosphate supplements to reduce urine calcium and kidney stone production. But trials were small and informal, so when a single and excellent trial showed lack of benefit our generation left phosphate by the wayside.
Science, however, has a way of correcting things. We now know that mutations in the gene encoding a kidney phosphate transporter (sodium phosphate cotransporter (NaPi) 2c (NaPi-2c) can lead to “idiopathic” hypercalciuria and stones as well as bone disease. The mutations reduce kidney ability to conserve phosphate. As a result, serum phosphate falls and multiple hormone signalers signal awry. Given this new knowledge, oral phosphate supplements seem an attractive treatment for special patients that a properly done kidney stone evaluation can identify.
One expects oral phosphate to help these patients. But as I thought about the matter I could not but look more broadly at how oral phosphate affects calcium stone formers in general. A bit to my surprise, I found impressive data from years ago that oral phosphate lowers urine calcium and stone production. This led me to wonder if my own generation has not so much overlooked as it has disdained phosphate because of a single but well done negative trial. Perhaps phosphate can prevent stones in general, and one trial was not enough. Perhaps phosphate can benefit bone. Perhaps oral phosphate poses hazards our forbears did not recognize.
Even more, our group published not so long ago a paper showing that low serum phosphate levels are commonplace among stone formers, and arise from reduced kidney phosphate reabsorption. And, more, low values of serum phosphate associate with other kidney function differences meaning that might foster stone formation.
So this article is really a three in one. I will show you how patients with mutations look, and how one can decide if gene testing is worthwhile. Given a defect, phosphate is one of two treatments far more specific than thiazide and diet. I will also show you what oral phosphate can do to reduce urine calcium in common stone formers taken at random, not to unreservedly recommend it but to bring this older remedy back in to modern focus in hope that my colleagues will reconsider it in a modern context. Of course I will show our work on the widespread occurances of low serum phosphate in stone formers.
Phosphate supplements may have unwanted side effects, which is why I have reservations about their use beyond replacement for patients with transport mutations. Dr Orson Moe (University of Texas Southwestern Medical School. Dallas) has graciously offered comments that conclude this article on a proper note of caution.
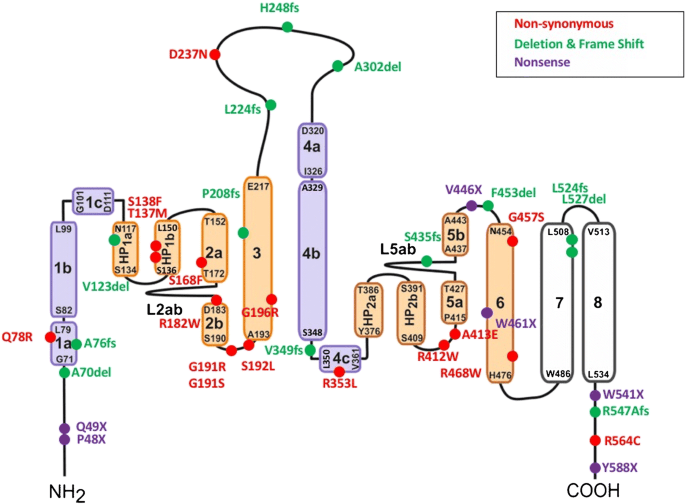
The featured picture is the sodium phosphate cotransporter in which defects cause phosphate wasting, hypercalciuria, kidney stones, and bone disease. The circles identify mutated regions that cause disease identified by 2018. I do not intend here to dissect out each one, but merely illustrate that disease causing mutations are numerous.
Phosphate and Calcium Handling
In my kidney stone book I have written out how phosphate controls calcium. You might want to download the book for reference to details. This picture is from the book. For convenience I offer a much simplified and shortened version here.
Roles of Vitamin D, PTH, and FGF23
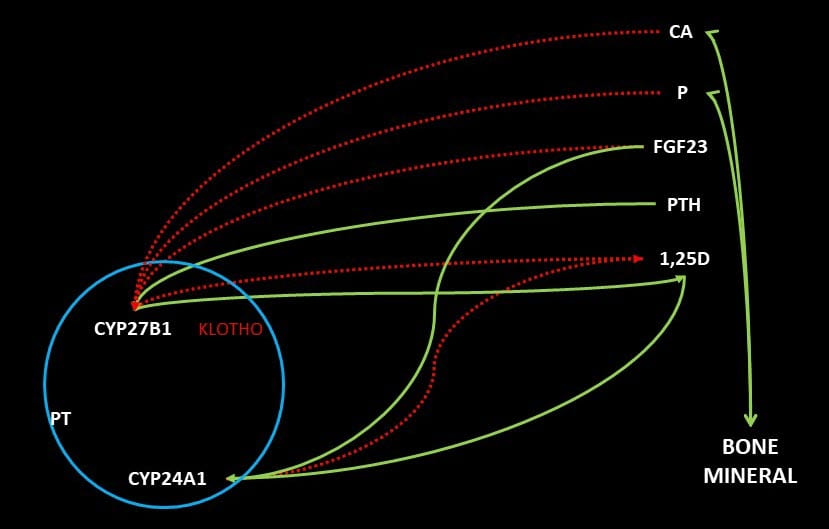 The storage form of vitamin D, 25 hydroxy D, is modified by kidney proximal tubule cells to the far more active 1,25 vitamin D by an enzyme called CYP27B1. This enzyme is down regulated by blood levels of calcium, phosphate, 1,25D itself, and FGF23, a hormone made by bone cells. It is up regulated by blood PTH. Another enzyme in the same cells, CYP24A1, inactivates 1,25D to 1,24,25D. This enzyme is up regulated by 1,25D and FGF23. All this is to say that in normal life a fall in blood calcium or phosphate will up regulate production of 1,25D both directly and by an increase of PTH in the case of a fall in blood calcium.
1,25D increases GI tract absorption of calcium and phosphate. It also suppresses PTH production and release. It acts on bone to increase turnover and loss of bone mineral. The net result is increased urine calcium excretion from a combine of higher absorption and bone mineral loss. The increase in urine calcium reflects lowered PTH, for that hormone increases renal calcium retention. It also can reflect an increase in blood calcium concentration with increase in how much calcium is filtered at the renal glomeruli.
Phosphate Regulation
1,25D increases GI phosphate absorption as well as kidney reabsorption of phosphate filtered out of blood by the glomerili. In the same proximal tubule cells that produce 1,25D, filtered phosphate is reabsorbed through two channels, NaPi-2a and 2c. In both, phosphate moves into the cells from the filtrate along with sodium. Sodium is reabsorbed because cells have low internal sodium concentrations due to the active transport of sodium out into the blood in exchange for potassium that is pumped in.
PTH and FGF23 both inhibit phosphate reabsorption by the kidney cells. Because 1,25D increases the abundance of the channels, it fosters reabsorption of filtered phosphate just as it increases GI phosphate absorption from food through a related channel (NaPi-2b).
Mutations in the NaPi-2c Transporter
Now, into this orderly and complex ballet introduce an actual damage to the NaPi-2c transporter in the form of any one of the many mutations shown in the large picture that heads this article.
What are The Mutations?
The large header picture lists non synonymous, deletion, frame shift, and nonsense. Although interesting to sort out and describe separately our purposes here aim elsewhere. So I can just say these can create a phosphate transporter that does not function properly. As a result phosphate handling by the kidney is abnormal. It is as though the level of a mill dam has been lowered. Serum phosphate falls like the water level in the mill pond. Daily urine phosphate losses are as unaffected as is the flow of the mill stream, for both depend on the source (the headwaters for one, GI phosphate absorption efficiency and diet phosphate for the other).
Most Patients are Heterozygous
When both copies of the gene are abnormal, the disease begins in infancy or childhood with bone disease and other severe manifestations. It is called hereditary hypophosphatemic rickets with hypercalciuria (HHRH). Among common stone formers, most have normal DNA coding for the transporter on one chromosome and an abnormal copy on the other chromosome (we have one from each parent). One calls them ‘heterozygous’ for the gene abnormality. Heterozygotes usually display ‘idiopathic’ hypercalciuria with or without bone mineral reduction. The normal copy prevents more serious disease.
The quotes around ‘idiopathic’ are a way to signal scientific progress. The word means producing disease or illness (pathos, or sorrow) by itself (ideos). But when urine calcium arises from a cause (NaPi-2c mutations, as an example) it is no longer ‘of itself’ but ‘explained’ by something with another name, its ’cause’. This simple string of words can lead us through the winding path and down into that shaded and dappled garden of mental delight wherein your author often dwells, and haply dreams about the ways of science and how one comes to understand the limits of human knowledge.
But not now; not here.
An Increased Fraction of Filtered Phosphate is Lost in the Urine
Normal Fractional Excretion of Phosphate (FEP)
In 24 hours we filter about 140 liters a day of water out of blood plasma, in which phosphate (measured as phosphorus) is about 1 mmol (32 mg/liter, or 3.2 mg/dl). Of this about 80 to 85% is normally reabsorbed leaving about 20% (140 L/d x 1 mol/L x mmol x 0.2 = 28 mmol or ~900 mg) to 15% (140 x 0.15 = 21 mmol or ~670 mg) for urine excretion. These estimates are reasonably in line with common 24 hour urine collections: 670 – 900 mg/d. Because phosphate balance in adults is neutral (we cannot produce or destroy it), GI absorption will generally balance urine losses.
Reduced FEP and Blood Phosphate
A common result of a NaPi-2c mutation is an FEP of 25% or more, which I will use as an example. At a normal filtration, and given an FEP of 25%, a person with 900 mg/d of urine phosphate will have a serum phosphate of: 140 l/d x 25% x (serum phosphate in mg/l) = 900 or 25.7 mg/l = 2.57 mg/dl – a very low value. Of course, daily phosphate excretion is indifferent to FEP itself because it depends only on GI phosphate absorption into blood and whatever phosphate is lost from bone.
My estimates are crude because the low phosphate concentration will increase 1,25D and reduce PTH and FGF23. In turn this will increase GI calcium and phosphate absorption and increase bone losses of phosphate and calcium into the blood and thence the filtrate and urine.
Reduced Bone Mineral Deposition
Initiation of bone mineral crystallization depends on the blood calcium x phosphate product just as urine supersaturation depends on the urine calcium x oxalate or calcium x divalent phosphate products. If present at birth, the low product will cause insufficient mineralization of bone – osteomalacia, and bone deformities with growth – rickets. In milder forms, bone may appear normal by conventional scans but contain excessive amounts of unmineralized bone matrix proteins (osteoid) with consequent risk of specific kinds of fractures. I do not wish to extend our discussion here into bone disease as my purposes are to introduce the idea of gene mutations in NaPi-2c as causes of stones.
Increase in Blood Calcium and Phosphate will Reduce 1,25D
Whatever the effect of a mutation on NaPi-2c the very actions of 1,25D will tend to restore 1,25D to its normal range but given the gene defect this can never be truly normal as the defect offsets everything toward higher 1,25D at any level of diet calcium and phosphate. In reality, since the defect is present at birth, we encounter people who have adapted over a lifetime. They will exhibit increased FEP, reduction of serum phosphate that depends on diet to some extent, a tendency to higher serum calcium, and to lower PTH all vs normal ranges. Urine calcium will be high and urine phosphate as well if diet phosphate is ample.
The Clinical Appearance of People with NaPi-2c Mutation
On average they will have increased risk of calcium stones because of higher than normal urine calcium excretion – hypercalciuria – driven by increased serum 1,25D. Calcium excretion is a powerful graded risk factor beginning at 200 mg/d. Higher urine phosphate has not been established as a stone risk factor. Blood calcium will be range from high normal to high on and off. Serum PTH will be normal to low, and phosphate concentration will be below the normal range. They will look like idiopathic hypercalciuria which is known to have high normal 1,25D levels, normal PTH, and not rarely, reduced blood phosphate levels.
This means that detection of mutations requires a sharp eye and measurements of 1,25D and PTH as well as, of course, serum phosphate. Strangely this last has faded from clinical attention as it is not in routine ‘metabolic’ blood panels primary practice physicians favor but must be sought in stone formers using ‘renal’ panels.
As already mentioned homozygous subjects will usually present in childhood with rickets and hypercalciuria: Hereditary hypophosphatemic rickets with hypercalciuria (HHRH). Adults without rickets, though usually heterozygous, may have subtle bone disease, with bone pain. Because phosphate is essential for energy production and especially critical for muscle contraction, HHRH can cause muscle weakness, often mild.
Detection in Clinical Practice
A recent overview gives us a good starting place. Because reduced phosphate reabsorption is a primary consequence of abnormalities in the NaPi-2c transporter, the authors suggest one estimate FEP in all stone formers with reduced fasting serum phosphate (<3 mg/dl). They propose a timed 3 hour urine collection but that is, of course, impossible in clinical practice. At best we will have a 24 hour urine with fasting morning serum phosphate which must suffice to detect significant increases in FEP.
Because FEP is urine phosphate excretion (urine volume x urine phosphate concentration) divided by filtered phosphate, and because filtered phosphate is serum phosphate x glomerular filtration rate (urine volume x urine creatinine concentration /serum creatinine concentration) and filtered phosphate the product of glomerular filtration rate and serum phosphate concentration, FEP is simply {U/P}p / {U/P}creatinine where all measures are in the clinical units of mg/dl. Certainly FEP above 20% with reduced serum phosphate would be an important clue.
Given reduced serum phosphate and increased FEP, increased serum 1,25D, and PTH that is not increased are helpful clues. One expects high 1,25D as the engine of hypercalciuria and stones, and that serum PTH is not elevated. Finally one needs to be sure about absence of obvious other diseases which the article mentions. If all of the above indicates a good chance of a gene defect, genetic testing is reasonable. The authors present a flowchart but to me it is too elaborate for our needs.
Disease Physiology in Patients
All of this is what one can deduce from physiology. Real patients with gene defects are a lot more complex and varied, so we have to look into some recent scientific papers and be sure we understand what to look for. My interest here is in patients with calcium stones who do not exhibit obvious bone or kidney disease, but seem like all other common stone formers. I say this because many gene defects can cause hypercalciuria and even stones along with renal, bone or other systemic diseases none of which are within the scope of this article.
This wonderful paper describes 20 patients with genetic defects in the NaPi-2c transporter. About half were simply heterozygotes with single gene mutations. The others had multiple gene defects and a few had defects of different kinds on both chromosomes. To give a sense of what one might find I have made some figures from data the authors present in multiple large tables. In addition, I have added 2 patients of mine with known gene defects to make a total of 22 (shown by triangles). Of the 20 in the paper, one was receiving phosphate treatment, so I removed that case because blood and urine data would be affected by the treatment. Three were receiving vitamin D supplements and I saw no reason to omit them. As I mentioned already, to their data I added 2 cases of my own that had mutations like those of some of the patients in the paper.
Urine Calcium
For stone disease this is the prime outcome of interest.
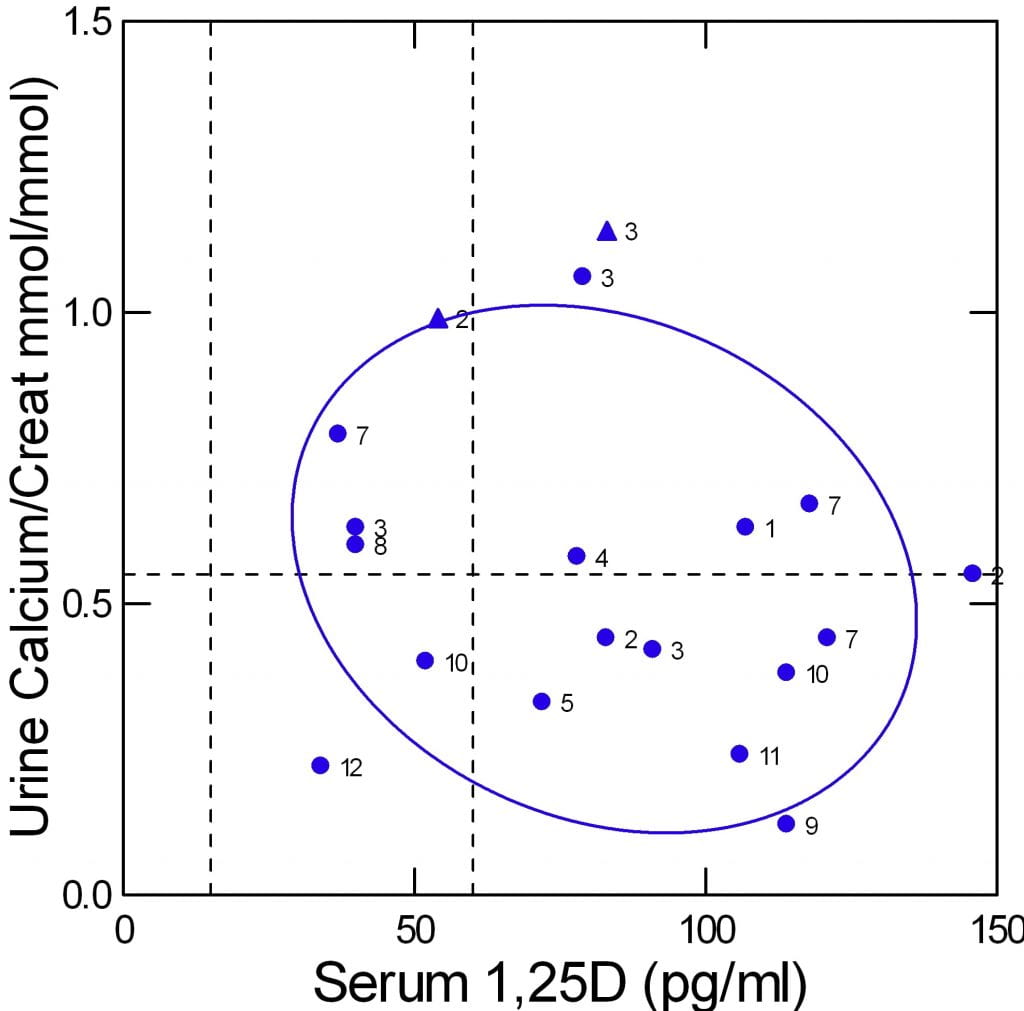 The authors offer fasting urine calcium concentration divided by urine creatinine concentration in mmol/mmol. I copied these along with serum 1,25D from Table 1 of their paper. In addition I added two patients I have studied and who have mutations like those in the paper (triangles).
The graph shows urine calcium vs. serum 1,25D. The normal upper limit for urine calcium is the dashed horizontal line, limits for 1,25D levels (almost all subjects were adult so I used adult limits) are shown by the vertical dashed lines.
One expects urine calcium to vary directly with serum 1,25D levels. But in a simple correlation matrix, their correlation was inverse and not significant (r=-0.197, p=0.42).
The graph visualizes this. The points are scattered widely. High 1,25D levels (above the upper limit) have more urine points in the normal range than high, whereas the opposite is true for normal serum 1,25D. The 95% ellipse of containment is broad and tilted downward to the right.
The numbers represent the gene defect found. I do not wish to burden this text with the details but you can see that people with the same defects may not be close to each other on the plot. My two cases are triangles. Their urine values are 24 hour, not fasting, and therefore among the highest because including of fed periods.
Although I have little doubt that 1,25D must play a major role in urine calcium regulation in this disorder, the data available from this study and my two cases do not show that.
Serum Calcium and Phosphate
Effects of Phosphate Reabsorption
One way to visualize the patients is serum calcium and phosphate plotted against kidney phosphate reabsorption. Once again, the two triangles are my patients, the other 19 are from the paper.
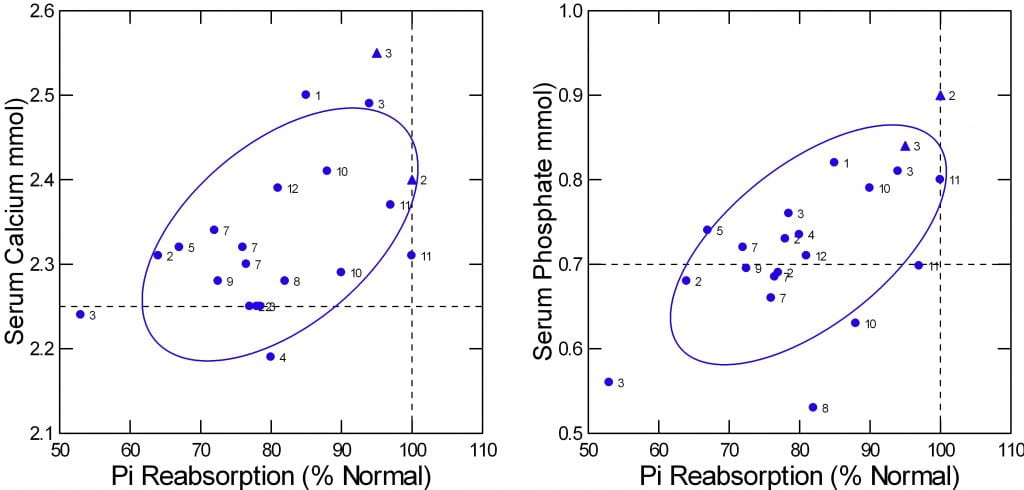
Phosphate reabsorption was measured in two ways in the study. One was as I described. Fractional excretion of filtered phosphate in % was subtracted from 100% to get reabsorption. The other was to calculate a ‘tubular maximal reabsorption’. To make the two compatible I expressed each as a percent of the lower limit of normal.
Of course serum phosphate varied with the % of normal phosphate reabsorption (r=0.66, p=0.002). Mathematically this is an oxymoron because serum phosphate is part of the calculation. So the graph is meant just to show the ranges of both values. As expected the mean reabsorption was 81.3% of the normal lower value and that for serum phosphate was 0.72 vs the normal mean of 1 mol/l.
The theory of the disease implies that serum calcium would be higher as phosphate reabsorption was lower – an inverse relationship. Lower serum phosphate would increase 1,25D that would increase GI calcium absorption and increase calcium loss from bone. As well, 1,25D would suppress PTH directly. What the data show, however, is a direct correlation (r=0.535, p=0.018). The lower the phosphate reabsorption the lower the serum calcium (Left panel of the figure just above). I cannot explain why theory so fails, but results are what they are.
PTH, 1,25D, and Serum Calcium and Phosphate
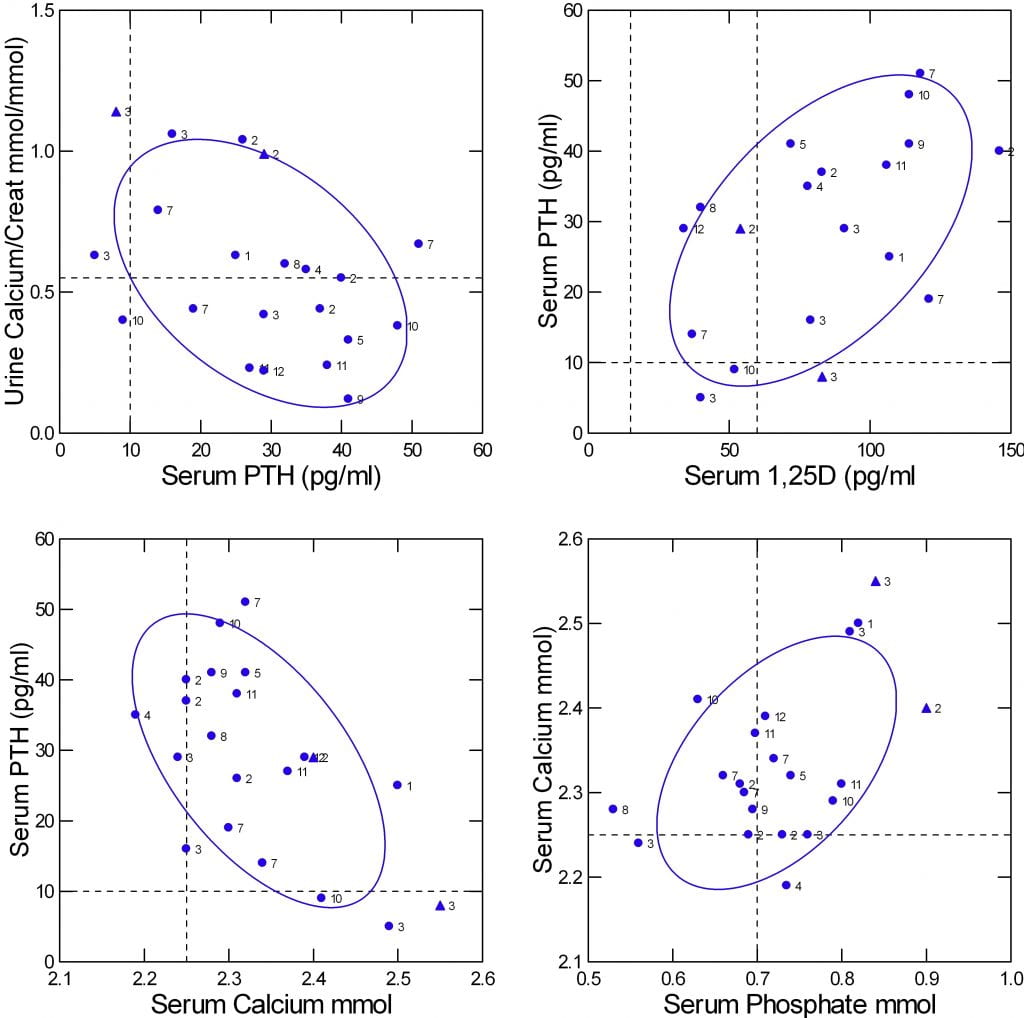
At least one prediction from physiology theory seems confirmed. Because PTH increases kidney calcium reabsorption one might expect urine calcium to vary inversely with serum PTH. That is true as shown in the upper left panel of the figure (r=-0.44, p=0.04).
Likewise, one would expect that serum PTH would be inverse on serum calcium, as the latter is a prime down regulator of PTH secretion. That is true (Lower left panel of the figure; r=-0.577, p=0.01).
One expects that higher serum 1,25D should suppress PTH, so the two should vary inversely with one another. Yet they do not (upper right panel; r=0.52, p= 0.02).
One also expects that serum phosphate should control 1,25D – lower phosphate more 1,25D. That is not true in this set of data (r=0.02, p=0.9); I do not show a graph.
As for serum calcium and phosphate, one expects that lower serum phosphate will raise serum calcium via a higher 1,25D. But the opposite is true: serum calcium and phosphate are directly correlated (lower right panel, r=0.49, p=0.03). Because of the small data set I could not use multivariable analysis to sort out the effects of PTH and serum calcium and phosphate and 125D on one another.
Another very similar study is in general agreement but with a few deviations. They studied 13 patients in whom gene abnormalities for NaPi-2c were present in 10 (3 of unknown significance). About half had elevated 1,25D levels and about 1/2 elevated urine calcium.
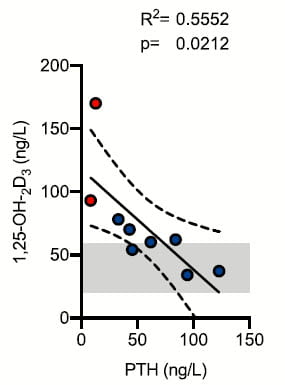
Unlike 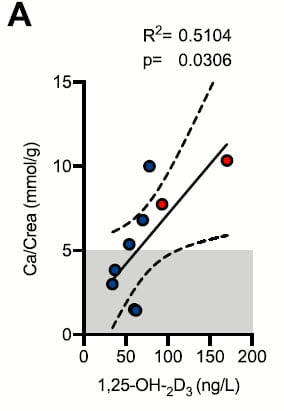 the prior study, urine calcium was correlated with serum 1,25D as one expects. This is illustrated by the small graph taken from the paper and at the left of this text. The divergence between this result and that from the prior one is not easy to explain, but small sample sizes and perhaps different conditions of the experiments may suffice.
Like the prior study, 1,25D and PTH were related. But the relationship was inverse as one might expect and can clearly see in the right hand panel.
I say ‘one might expect’ because low phosphate should raise 1,25D as a main effect and 1,25D suppress PTH production and release. If you go back to the prior study results (upper right panel of the four plot) results are the opposite of this one.
I think these divergences tell us that whereas the main outlines of pathophysiology are reasonably clear, details will require larger studies and perhaps analyses within a more narrow range of gene defects.
Treatment
 Howsoever much details of physiology remain to be clarified, our primary interest in this disease complex arises from new treatment alternatives. I have little to show as yet, but it is promising.
Oral Phosphate
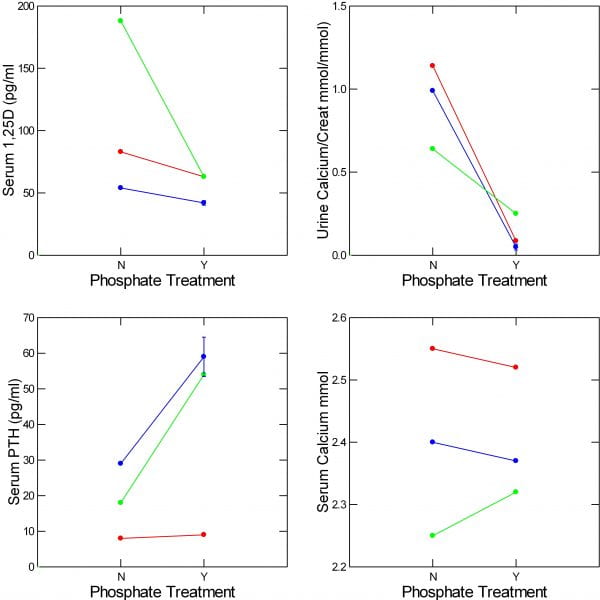
Since the primary problem is renal phosphate wasting one might think that phosphate supplementation might reverse some of the abnormalities. In my two cases I gave oral phosphate supplements (250 mg twice a day) to lower urine calcium. A PubMed search on 3/25/23 using “NaPi-2c OR SLC34A3 AND mutation AND treatment” disclosed 19 references. Among these I found one more individual treated patient (a compound heterozygote) who I could plot alongside my two.
In the two patients I have thus far treated (red and blue) and the third published case (green) serum 1,25D (upper left panel) and urine calcium (upper right panel) both fell. Changes in serum calcium and PTH were not consistent across the three cases.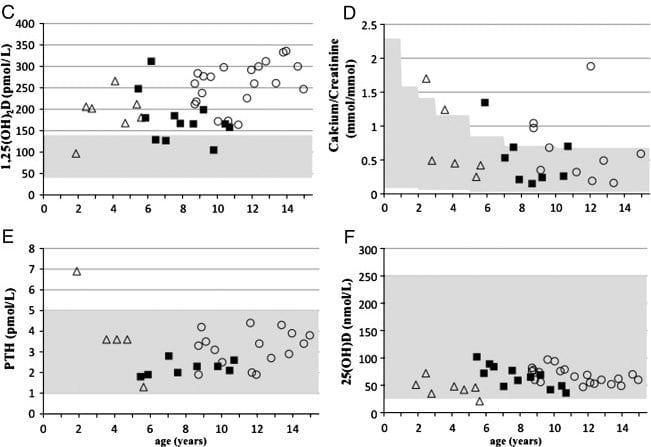
One other publication described a kindred with homozygous and compound heterozygous mutations in the NaPi-2c gene and included some long term phosphate treatment data. Since they did not tabulate their treatment data I cannot graph it with the other 3 cases, but they provide a very nice graph of their own.
These patients were children, some with significant bone disease, but they were hypercalciuric and many had formed kidney stones. Over some years of treatment, urine calcium remained in the normal range (shaded area) for age. Serum 1,25D remained elevated, unlike in our adults. PTH and 25D levels were normal. The authors do not quantify stone activity.
Fluconazole
This drug inhibits CYP24b1 and therefore can lower 1,25D levels in patients with NaPi-2c gene disorders as well as other disorders in which elevated 1,25D causes hypercalciuria and stones. This paper describes a 15 year old boy with nephrocalcinosis discovered on a routine flat plate obtained for orthopedic reasons. A gene defect for NaPi-2c was documented along with high serum and urine calcium, low serum phosphate, high serum 1,25D and low PTH.
| MEASUREMENT | BEFORE TREATMENT | 50 MG FLUCONAZOLE | 100 MG FLUCONAZOLE |
| SERUM CA (mmol/l) | 2.72 | 2.54 | 2.39 |
| SERUM PHOS (mmol/l) | 1.25 | 0.87 | |
| SERUM PTH (ngl) | 8 | 6 | 16 |
| SERUM 1,25D (pmol/l) | 279 | 151 | 95 |
| URINE CA (mmol/kg/d) | 0.2 | 0.14 | 0.08 |
The table sums up the story. Before treatment all values were abnormal (for that lab in children) except serum phosphate (shown in bold). At the lower dose, fluconazole brought the 1,25D to normal but not urine calcium or PTH. At the higher dose all values were normal except for the low serum PTH. I chose this case to illustrate the ruling effects of 1,25D which when lowered in turn brings the other critical values into the normal range. Other recent papers illustrate interest in this drug. A trial is planned for it in this and other high 1,25D conditions.
Clinically, physicians may wish to use this drug in patients with fully established gene variants instead of oral phosphate. We are so early in clinical management I can have no opinion about choice except that fluconazole will not present the complexity of increased urine phosphate but has its own side effects.
Oral Phosphate for Common Stones
The remarkable power of oral phosphate to lower urine calcium in the few patients with NaPi-2c defects I have shown here naturally prompts the question about its effects in ordinary stone formers. After all, phosphate is a down regulator of 1,25D and should lower 1,25D level in routine stone patients. That should lower urine calcium.
My partner Dr Elaine Worcester was kind enough to look for and send me 7 articles concerning what happens when oral phosphate is given to routine stone formers. I have cumulated data from 5 of the 7 so I can show you what it does. In fact, long ago, physicians used oral phosphate to prevent calcium stones and published ample evidence that phosphate supplements could lower urine calcium.
The Papers
The earliest paper (1965) arose from the then famous Leeds stone program. It included 10 patients (labeled by me as ‘H65’). Urine calcium was measured at baseline and after 6 weeks of 1500 mg of oral di-sodium hydrogen phosphate supplements – alkaline phosphate. Eleven years later Ettinger (1976) published a trial of acid phosphate (1400 mg/d and increased if stones persisted) on stone prevention in 25 patients and within the paper gave means and SEM for baseline and treatment urine calcium levels at 3, 6 and 12 months, and 2 and 3 years. Hypercalciuria was at that time thought to arise from heightened GI calcium absorption, so diets were adjusted to a low intake of about 600 mg calcium/day. I present here only the baseline and 3 month results (labeled ‘BE”). Thomas (1978; ‘WT”) provided data on 4 stone formers with baseline urine calcium and during the fourth day of 1500 mg/d of neutral, acid, or alkaline phosphate with a dairy product free diet. Peacock and colleagues (‘HRP’, 1982) presented results from 38 patients given 1000 mg of neutral phosphate. They present means and SEM baseline for cohorts studies over 3 months, and 1-4 years. I present the largest (3 month) cohort. All had been on low calcium, low oxalate diets for stone prevention and continued on that diet during phosphate treatment. Isogna and colleagues (‘IBU’, 1989) studied 36 stone formers given a low sodium low calcium (400-600 mg) diet along with neutral phosphate 1500 mg daily. Trichormethiazide was studied as a contrast and most patients received each drug in an alternating schedule – a matter not relevant here. We have only means and SEM available at baseline and 6 weeks. A study by Finlayson (1976) provided only urine calcium concentrations, and another by PaK (1972) provided only saturation data.
Effects of Oral Phosphate
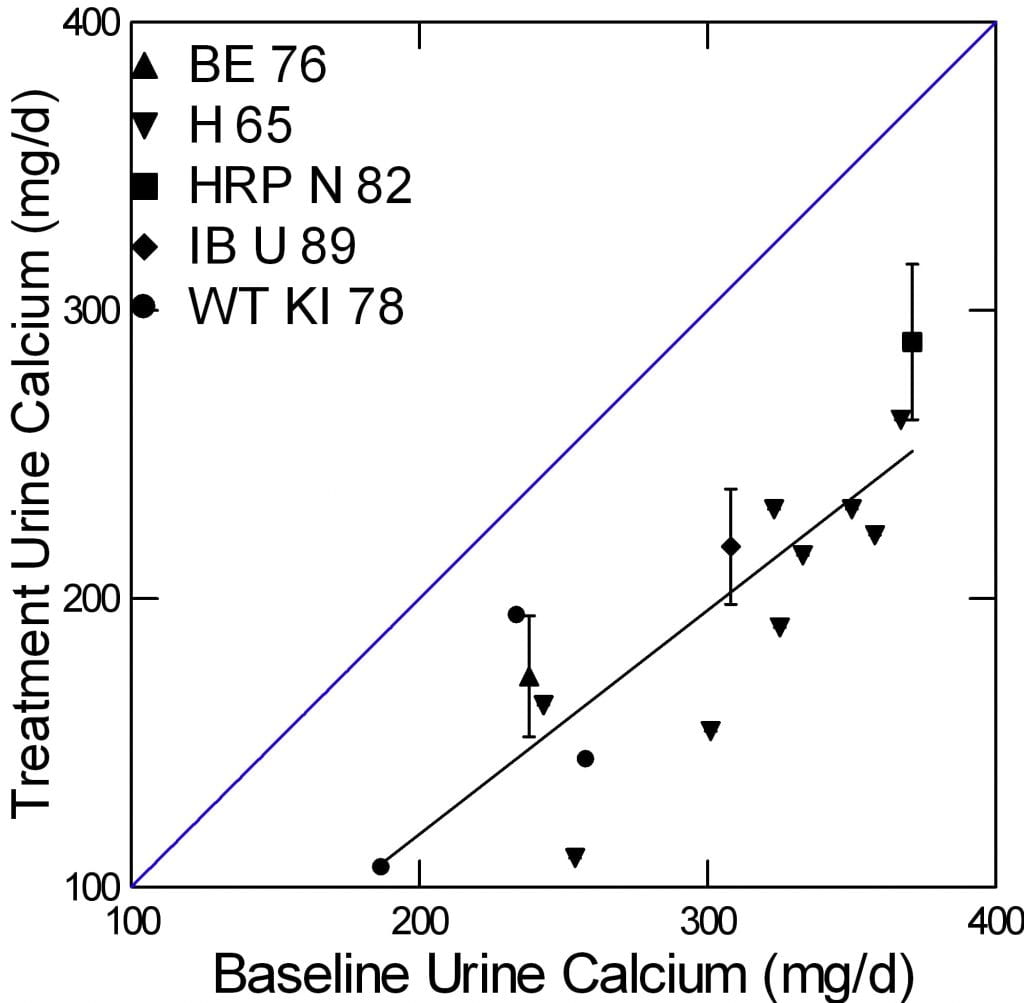
The five studies are shown by contrasting symbols identified in the legend. SEM are shown for the three studies that provided only mean data.
The blue diagonal is the line of identity so points below that line mean treatment lowered urine calcium. The slope of the line (regression of treatment urine calcium on baselin)e was highly significant (slope = 1.04±0.13, 95% CI 0.75, 1.32, p<0.001). More important, the downward offset of all of the points (intercept for those who care) was -98±39 mg/d (95% CI -185, -11.6, p=0.03). So one can more or less expect about a 100 mg/d fall in urine calcium with 1000 to 2000 mg of oral phosphorus. (For the more involved, this is given a context of lowered diet calcium.)
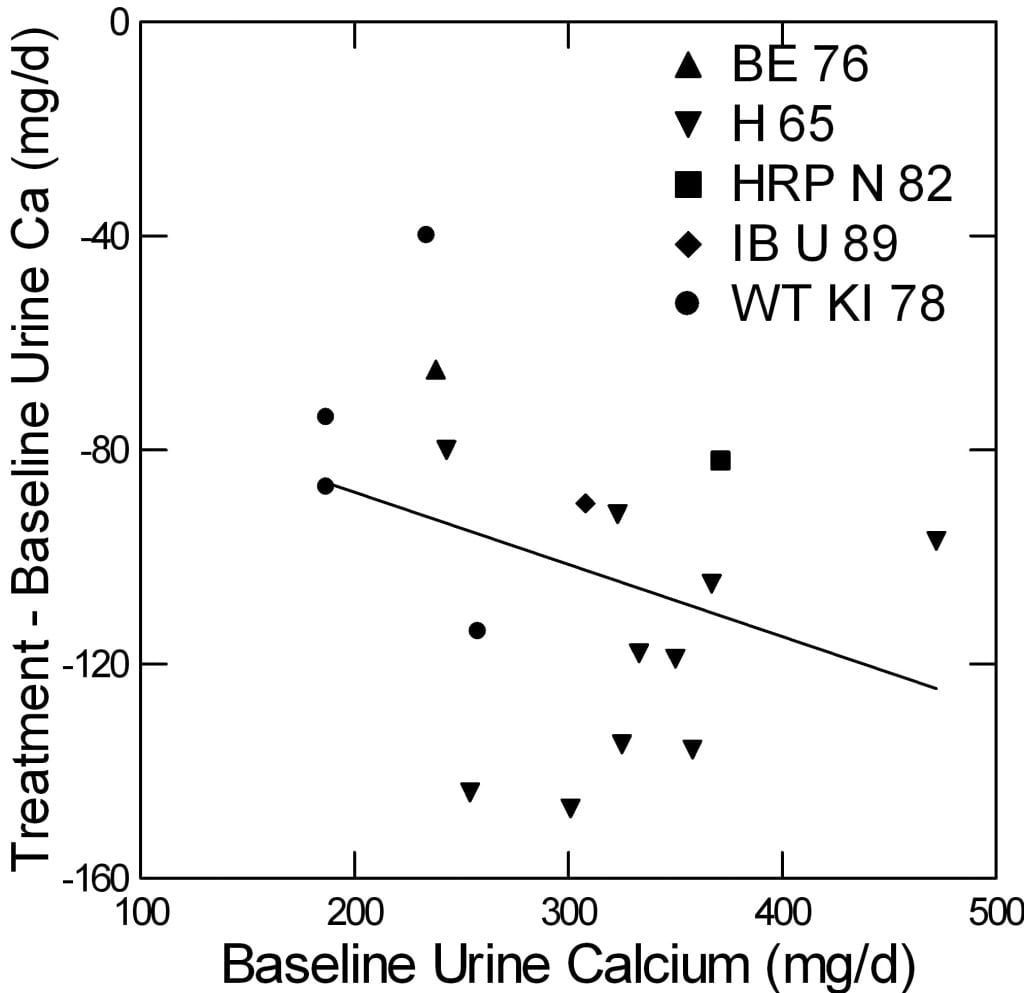
Another way to visualize these data is plotting the change in urine calcium against the baseline calcium. This can give a sense of whether the fall one gets depends on how high one is to start with.
The scatter is large, and the regression is not different from 0. But the intercept, which estimates the downward impulse from phosphate (-61±30; 95% CI -15,3; p=0.06) gives some idea of the overall effect. Elsewhere I have shown that in prospective trials thiazide produces more or less an equivalent effect of about 80 mg.
Could This Be from the Alkali Effect?
No. Several of the studies contrasted acid vs alkaline phosphate and both produced equivalent reduction of urine calcium. I do not wish to make this article overly overlong, and so omit proof.
Where Does the Calcium Go?
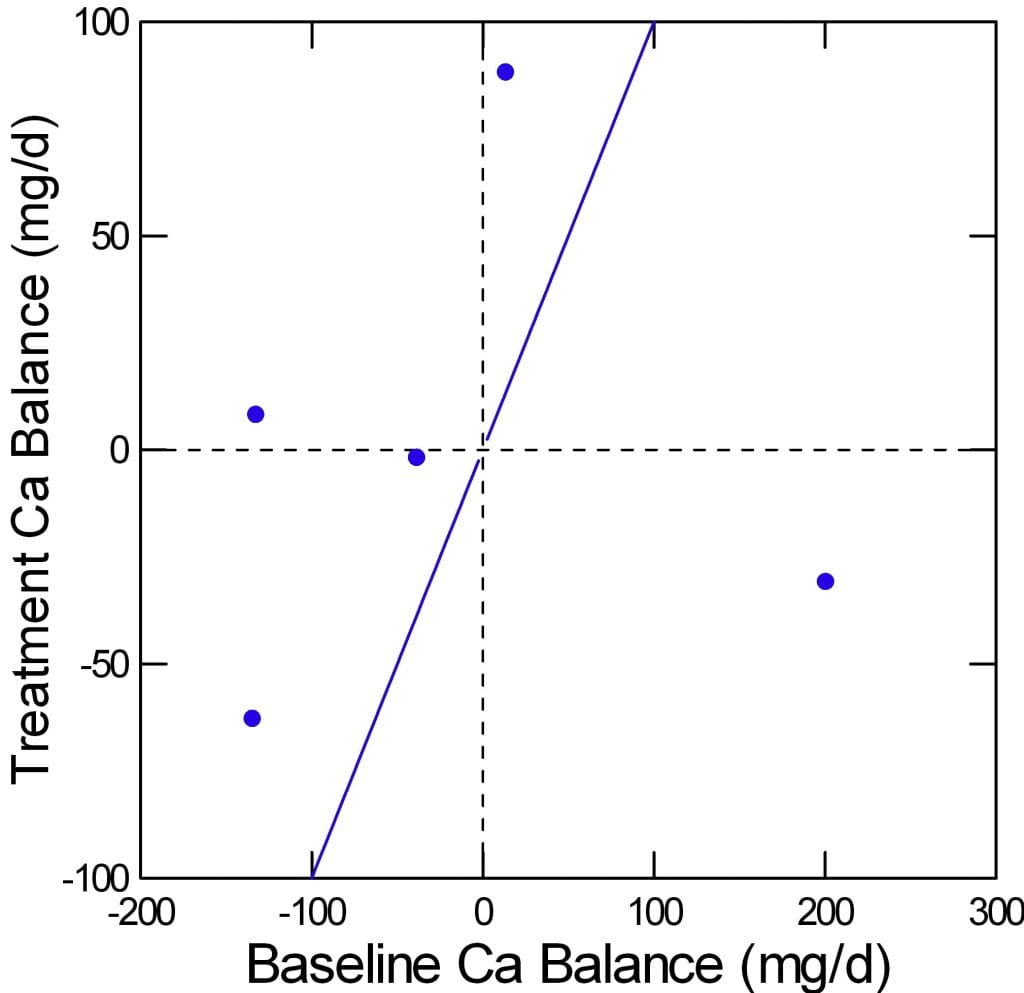
In five patients, the Leeds group performed calcium balance studies baseline and during phosphate supplementation. I described the method in the article on idiopathic hypercalciuria, and those interested can have a look. Briefly, urine and fecal calcium are measured before and during oral phosphate supplements. I did such a balance and showed that chlorthalidone lowered urine calcium, as expected, lowered GI calcium absorption (as others had found) but less than it lowered urine calcium. So the drug improved calcium balance.
Here are the balances for the five patients. The baseline is on the x axis, treatment on the vertical axis. The diagonal line of identity runs from lower left to upper right.
Four of the five patients increased their calcium balance with phosphate. For example the point at about -150 at baseline rose to about -60 with phosphate. Since there is really nowhere to store calcium in any appreciable amounts beside bone, this is usually taken as evidence that bone mineral balance has improved.
More important, perhaps, it argues strongly against the obvious and reasonable idea that a lot of oral phosphate will bind calcium in the bowel lumen and prevent its absorption.
Thiazide and Calcium Balance
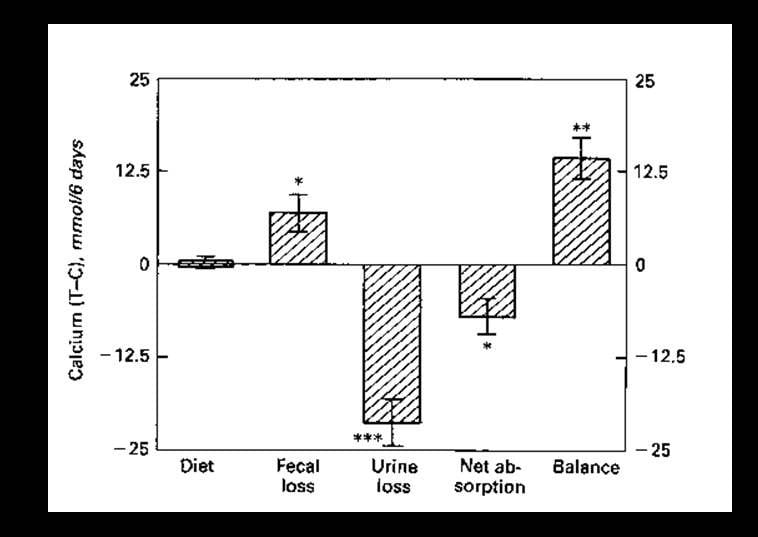
Perhaps because the Leeds balances recall to mind my own youthful immersion in this form of athletic detail compulsiveness, I offer this graph from work I published in 1988. It shows the same kind of results for thiazide like drugs that lower urine calcium and are widely used in calcium kidney stone prevention.
A small group of patients with idiopathic hypercalciuria and stones was studied over 6 days before and after 6 months of chlorthalidone – a thiazide like diuretic. Their diets were fixed and provided to them in a clinical research unit, so the difference (y axis, T – C) in diet calcium between treatment (T) and control (C) periods was 0 (Y axis). Loss of calcium in the stool rose (fecal loss) with chlorthalidone. Since calcium intake was fixed, net absorption of diet calcium fell. But urine calcium fell more, so net bone balance increased. The increment of about 13 mmol/6 days is about 86 mg/d, surprisingly close to that from phosphate.
Serum Phosphate is Often Low in Stone Formers
Ranges in Two Populations
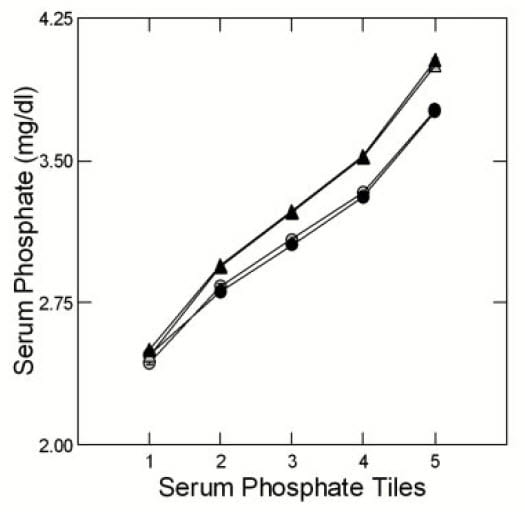 Having noticed many stone formers with serum phosphate levels below the common 3 mg/dl (~1 mmol) we collected and published data from 2700 patients (932 women) from our own practice (UC) and 11,073 (4798 women) from Litholink Corp (LL). Using statistical algorithms we grouped the data from both populations, separately and by sex, into five groups calculated to contain equal numbers of cases. As an example, the LL tiles were: <2.8; 2.8 to <3.1; 3.1 to <3.4; 3.4 to <3.7; and >=3.7 mg/dl (corresponding to outpoints at (mmol) 0.9, 1, 1.1, 1.2 (all values rounded from 3 to 1 decimal point). So 20% were below the normal value (lowest pentile) and another 20% ranged from low to normal.
The figure shows the mean serum values for each pentile for UC (circles) and LL (triangles) by men (black) and women (gray). The mean for pentile 1 (20% of patients) is at 2.5 mg/dl, or 0.8 mmol, low indeed. The second pentile mean is at 2.85 (UC and LL combined) or 0.92 mmol. If you look back at the figures for gene mutation patients, 0.8 mmol is within their range.
A Word about Significance
One can model changes in some continuous variable like serum phosphate as a function of a classifier like phosphate tile. From the model one can derive significance values for differences between tiles and, more important here, for the trend, if any, for the continuous variable to change with tile number. This trend is not exactly like a slope value. It is more an estimate of whether consecutive increases or decreases in the continuous variable accross the tiles differ from chance. In all cases discussed here the trend differed from chance by below 0.1%, so called p values of <0.001.
Phosphate Reabsorption
 The five serum phosphate ranges correspond to 5 different levels of kidney phosphate reabsorption.
I use Tm phosphate here because I like it.
All the phosphate filtered is either reabsorbed in the proximal tubule (PT) or lost in urine – there is no phosphate movement between blood and tubule fluid beyond the PT. More or less, water extraction to concentrate the urine begins after the PT. The same for creatinine – filtered and secreted into the PT, lost in urine. So the ratio of urine to plasma creatinine (U/P)cr marks water extraction.
If we divide urine phosphate concentration (Up) by (U/P)cr we have an estimate of tubule fluid phosphate concentration in PT. The difference between it and serum phosphate (Sp) estimates the capacity of PT cells to lower tubule fluid phosphate via reabsorption:
Tm Phosphate = Sp – (Up/(U/P)cr).
The value of Tm Phosphate varies directly with serum phosphate tile meaning that the difference between serum phosphate and urine phosphate scaled for water extraction is lower despite a lower serum phosphate – the kidney is less avid for filtered phosphate when serum phosphate is lower.
For example the mean serum phosphate in pentile 1 is about 0.8 mmol; TmP is about 0.61 mmol: that is the difference achieved accross the PT membrane. For the highest pentile the TmP is about 1.06 mmol the serum phosphate is 1.29, so the PT is creatining a greater absorptive effect. I could do this in FEP (about 28% for pentile 1 and about 15% for pentile 5) but it is a less colorful kind of index.
Urine pH
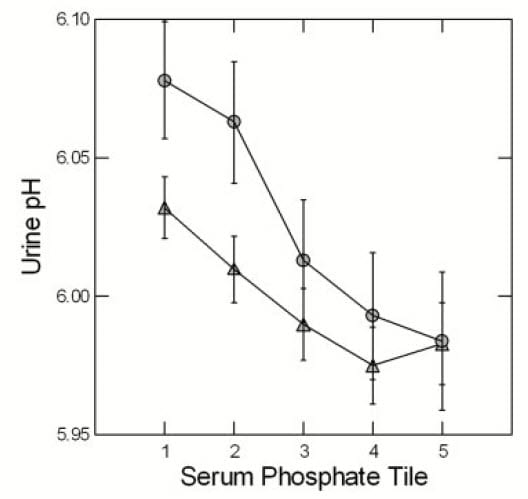
At LL (triangles) and UC (circles) urine pH rose with falling phosphate pentile. The display is for men to reduce page crowding but results are the same for women. One expects that higher pH will increase CaP supersaturation and in fact SS CaP rose as serum phosphate tile fell. Both of these trends are significant. Perhaps indeed, if we looked carefully CaP stone formers will tend to exhibit lower serum phosphate values along with their high urine pH.
Since an initial formation of brushite -like phosphate crystals may well initiate calcium oxalate crystallizations, CaP SS is potentially crucial to calcium stone formation, a matter detailed elsewhere on this site.
Serum Uric Acid and Urine Calcium
I will not show the data but simply say that a striking feature is fall in serum urate with falling phosphate tiles. Both are reabsorbed in PT, urate is also secreted. The correspondence suggests some linkages between phosphate and urate handling and pointes to possible molecular systems involved. Interested people can read the paper. All I mean here is that among stone formers there exists powerful gradients of phosphate handling that seem linked with other transporters and with potential stone risk.
Urine calcium also varies significantly with phosphate tile. It is highest in the lowest tiles and the reverse. This means that as a rule lower serum phosphate values associate with higher urine calcium values. More bluntly, patients with lower serum phosphate have higher urine calcium and therefore more stone risk in general.
What Have I Learned?
Gene Defects May Guide Treatment
Superb science in many labs have disclosed genetic variations in the gene for NaPi-2c that result in a picture much like idiopathic hypercalciuria but distinguishable clinically by low serum phosphate, reduced renal phosphate reabsorption, and high 1,25D. Although we have no doubt been treating these patients as we treat all IH calcium stone formers, they are candidates for oral phosphate supplements or fluconazole and both treatments seem – despite our small store of clinical outcomes – as powerful as thiazide, at least presently.
In calcium stone formers with low serum phosphate and high or normal 1,25D and low phosphate reabsorption it is worthwhile to make the gene measurements. Judging from the few papers I have reviewed for this article, serum phosphate was low in virtually everyone with a gene defect. As well, serum 1,25D was above normal (mean 82.5) in a majority of patients, and PTH could be anywhere from normal to low, (mean 28). Phosphate reabsorption was below normal almost all the time and can be calculated (in my opinion) from any 24 hour urine and serum phosphate.
Oral Phosphate Sans Gene Defects
What about phosphate supplements for stone formers in whom a NaPi-2c gene defect is not present nor suggested by clinical clues?
One May Have Reasons to Use Phosphate
It is easy to state the case for using phosphate more generally. Oral phosphate was once considered an excellent stone prevention by physicians as wise as we who published their data in as rigorous a manner and with presumably identical respect for the truth as we possess. But certainly we need new trials that include estimates of risk as well as stone prevention.
As clinician devoted to stone prevention, and faced with a hypercalciuric patient in whom thiazides and diet treatment have failed, I might scruple to use oral phosphate, perhaps 250 mg twice daily, even in advance of trials. Risk from multiple stones may well over balance that from modest amounts of oral phosphate supplements. I might, so to speak, do what was done by physician scientists who dominated kidney stone research when I was still in training, or at the very beginning of my professional career.
Perhaps, again as a clinician, I might feel more inclined to use oral phosphate in those common calcium stone formers with lower than average serum phosphate values (below 3 mg/dl). I have no basis for this as yet but certainly some in the renal community will one day begin doing some trials of phosphate for stone prevention.
One May Have Misgivings About Using Phosphate
Even so, phosphate has an obvious drawback – urine phosphate and, because we tend to use alkaline phosphate salts, urine pH will both rise. This will tend to raise CaP supersaturation and stone risk. So the balance between fall in urine calcium and increase in urine pH and phosphate will be the benfit or not of the supplement. Though important, therefore, this is a managable problem.
But I have not presented the crucial case against phosphate supplements. They may be a health hazard quite apart from matters of stone prevention.
To present these hazards properly one needs an expert in this area, and Dr Orson Moe has consented to add his views to this article. He is an active investigator in the area pf phosphate metabolism, and possesses outstanding expertise.
Concerns About Oral Phosphate (Dr Orson Moe)
 Here we are considering the use of phosphate as a treatment in stone-formers with idiopathic hypercalciuria or a forme fruste of renal phosphate wasting secondary to hypofunctional alleles of the NaPi-2c, the Na-coupled phosphate transporter.
Organic phosphate is ubiquitous in all natural food that contains phospholipids, nucleic acids, nucleotides, phosphoproteins, and phosphoglycans, rendering a low phosphate diet challenging and a phosphate-free diet impossible. In contrast to naturally-occurring organic phosphate, the phosphate present in additives are extremely bioavailable and sometimes can exceed the natural organic phosphates in quantity.
The undesirable effects of phosphate on patients with chronic kidney disease has been documented and stated. The effect of phosphate load in individuals with normal kidney function has been documented in individuals with cardiovascular disease and even in normal healthy subjects in epidemiological studies. The cardiovascular effects of high phosphate intake have been traced down to intermediate phenotypes.
While epidemiological data are merely associative, the causal relationship between high phosphate and cardiovascular and metabolic phenotypes have been documented in preclinical rodent models (Hu 2015, Peri-Okonny 2019, Maique 2020). While there is no clinical data to prove phosphotoxicity to date in patients with normal kidney function, what is undeniable is the fact that the Western diet is dominated by added highly bioavailable inorganic phosphate, and contains much more phosphate than what is required for health maintenance.
While there ought to be general caution regarding dietary phosphate “excess” which is by-and-large universal in the modern Western diet, one needs to consider special situations being discussed in this monograph. Patients may be slightly depleted due to chronic low grade renal wasting, or when phosphate is efficacious in limiting intestinal calcium absorption. These may be clear indications for giving phosphate supplement where the benefits outweigh whatever potential risks on cardiovascular disease. At this juncture, if one visualizes clear benefits from phosphate therapy, the potential cardiovascular and metabolic risks may be acceptable.
Dear Dr. Coe-
Thank you for your research on this issue. I met with Jill Harris yesterday (2/16/23) to discuss kidney stone diet and calcium phosphate stones, which I have had for over 30 years. I have sent Jill my latest Litholink report. I have osteoporosis and my doctor has ordered a ReClast infusion at the infusion center. In reading this paper, it seems there may be a problem with how calcium is processed. At this time, I have an appointment with my urologist and nephrologist next month. We are still looking into genetic testing options, (so the renal tubular acidosis has not been genetically tested). I have very little to no urine citrate and a high pH. Kidney stone breakdown is 100% calcium phosphate. In the meantime, do you have any thoughts on the ReClast infusion? You had answered a comment I left in another one of your papers, and I forwarded your message to my PCP. Thank you.
Hi Laura, I am very much in favor of gene testing for distal renal tubular acidosis as you may indeed have it. I would be sure about my serum phosphate – if it is low, there are other alternatives as well as RTA. Likewise your serum 1,25D – if I have not already mentioned it in another response. Reclast is a bisphosphonate and can also be taken as a once a week pill saving all the fuss of an IV infusion. Regards, Fred Coe
Dr Coe, Do you have any comments or writings on Hypophosphatsia and it’s relation to Idiopathic Hypercalciuria, and kidney stones?
Hi Eileen, I have one patient with this gene defect but without the dental and bone abnormalities in a prominent form. I looked for and failed to find a link to kidney stones. That is all I know. Fred
Thank you kindly for taking the time to reply. I will continue my search for information as I await final confirmation of this rare diagnosis. Thank you also for all you do to promote learning of all things kidney stone related. I want you to know the knowledge I gained from your writings has helped keep me stone free since 2018. I am forever grateful to you that I found this information very early in my stone journey. Be well. Eileen
Hi Dr Coe,
I wanted to ask you about systemic conditions that might drive abnormally low urine pH and/or low urinary citrate. In scouring your site I did uncover that abnormally low urine pH might be driven by CKD, obesity, diabetes, gout, insulin resistance and metabolic syndrome. I have not been able to find any info on what system conditions, if any, might drive low urinary citrate.
My husband was treated for 5 kidney stones across both kidneys in 2016. 2 stones analysed were 50% uric acid dihydrite 50% calcium oxalate monohydrite for one and 70% calcium oxalate monohydrate ,15% calcium oxalate dihydrate, 15% carbonate apatite for the other. Since 2016 he has been on potassium citrate, Indapamide and bp medication. Since 2016 his labs and litholink results have steadily improved and normalized with no stone recurrence. eGFR is currently 79.
However in 2021 Litholink showed an unusual downward fluctuation in both urinary pH and citrate. Results to compare:
07/2021 …… all good
pH 6.877
SS CaP 0.34
cit24 585
SS UA 0.04
UA 24 0.541
12/2021…… what!
pH 5.524
SS CaP 0.15
cit24 315 .
SS UA 1.13
UA 24 0.679
*04/2022…….!!
pH 5.665
SS CaP 0.14
cit24 300
SS UA 0.69
UA 24 0.726
*At this point our urologist at UTSW Dallas increased Pot Cit. dosage and next results were
09/2022 …back in good territory
pH 6.986
SS CaP 0.70
cit 24 873
SS UA 0.05
UA 24 0.835
07/17/23 – results still to be reviewed with urologist, LItholink summary results interpretation states “Despite high urine pH calcium phosphate stone risk is not elevated”
pH 7.224
SS CaP 1.09
cit 24 681
SS UA 0.03
UA 24 0.662
So far our urologists cannot explain urine pH and citrate fluctuations 12/2021 – 04/2022. Original Pot Cit ER was 60 Meq/Day in 2 doses increased to 75. With latest results we asked to reduce back to 60 until our next appointment as we are getting nervous about it getting too high!
Additional details that may be relevant are;
– stones did cause some damage and one kidney only does 25% of the work load.
– also around 7/2021 the urologist discontinued allopurinol, at our request. My husband has never had gout.
– Allopurinol was started by a nephrologist in 2018 who had diagnosed CKD Stage III. When I read your advice on allopurinol and uric acid stones I asked her why she prescribed it and never got a clear answer. When eGFR went back into normal range and we questioned her diagnosis of CKD III she actually retracted it and said she wasn’t sure! So the possibility of CKD is still confusing and an open question in my mind. We no longer see this nephrologist.
– our urologist was confident that discontinuing allopurinol would not account for the fluctuations .
We are pursuing the systemic conditions that drive low urine pH with our PCP. My husband may have developing insulin resistance, he is overweight and the jury is still out on CKD. Since metabolic syndrom does include raised uric acid levels do you think the allopurinol was masking this condition and that discontinuing the allopurinol has revealed it?
Thanks so much for any thoughts you might have on all this. The site is so interesting to study and very helpful.
Regards
Colleen
Hi Coleen, I imagine that the variation arose from his underlying diseases – insulin resistance, perhaps obesity, diet. You do not show sulfate or ammonia but these may encode a clue. I should add that UTSW has been a leading center in study of urine pH in uric acid stone formers, so he is in the right place. As for CaP SS with rising urine pH, I suspect urine calcium is not very high, making that risk lower. Regards, Fred Coe
Hi Dr Coe,
I’m mid-40’s w/no history of stones. I took (on an empty stomach) a 10mg Piperine tablet (with 300mg Ca Phosphate as filler) along with 150mg each Quercetin, Rutin, & Ascorbic acid (the whole combo was for allergies) within ~20 minutes I had extremely white cloudy urine with white sediment, presumably Ca Phosphate, which only lasted for ~15 min. Is this expected to occur with 300mg Calcium Phosphate on an empty stomach, or was the concurrent Quercetin/Rutin possibly causing this (maybe via Carbonic Anhydrase inhibition as Quercetin seems to cause this at micromolar levels)? Would a few short-term incidents like this cause any harm? Thanks for such an excellent website!
Hi TJ, Your experiment was worrisome and I would not repeat it. Your explanation for the cloudiness seems all to accurate. Fred
Hi Dr Coe,
I have an embedded stone that couldn’t be retrieved during Ureteroscopy since it was surrounded by tissue. It showed up again in a recent unrelated abdominal ultrasound. Is it possible for the stone to cause pain if it is embedded? Can it ever break free of the tissue and enter the collection system? This seems to be so rare I can’t find any information about it.
David
Hi David, It should not cause pain but I have heard any number of patients tell me they do indeed experience pain from precisely such stones. Possibly the stones cause inflammation that produces pain. In the absence of trials I would not endorse surgery to remove such stones, but might endorse a trial. Regards, Fred Coe
Hey Dr. Coe. Great article, I’m still reabsorbing it 🙂 I had my entire genome sequenced and I have many hetero and homogeneous variants in the SLC34A3 gene exon and intron areas. Example: at the exon location 9;137,235,403, I’m homogenous ‘C’, when the reference allele is ‘G’. Can you list the locations or SNPs for the known troublesome variants in the SLC34A3 / NPT2c gene so I could compare my alleles at those locations? Thanks and I hope you are well. Mike
Hi Mike, you are a staunch advocate for yourself, and all praise to you. The best source for all of the variants- being a legal requirement – is on the reports themselves. They list each of yours along with what is known and give references. By now there are so many I need to update my article, and wonder if it is the right thing to do as new variants are found all the time. Let me know the final answer. Fred
Hi Dr. Coe,
Do precautions on the use of phosphate for idiopathic hypercalciuria apply to newer versions such as K-Phos? A study showed that “UROPHOS-K” did not increase serum potassium or phosphate, but raised urinary potassium and phosphorus, and reduced urinary calcium (PMID 7785460). Would this make it acceptable for persons with normal serum phosphorus levels and normal kidney function? Or do the precautions apply to all “oral phosphates”? Would there be any other options for lowering urine calcium and PH in a “pre-stone “patient with calcium phosphate crystals in the urine?
Thanks,
Richard
Hi Richard, Phosphate was once a prime treatment for calcium stones but no longer in fashion. I cannot recommend it for stones apart from those with gene defects for the reasons mentioned by Orson Moe in his invited comments to my article. There is concern about cardiovascular disease. Regards, Fred