


Elsewhere we have described an innovative web based course aimed at reducing kidney stone risk factors via improved diet. Briefly, the course helps patients whose physicians have prescribed diet and fluid changes implement those changes, by teaching them to choose the right foods and fluids. We have articulated the underlying science of the kidney stone diet upon which the course is based. Here, Jill Harris and I present the outcomes of her on-line diet education course to illustrate that one can change lifestyle in this manner.
The powerful innovative element is that the course lives online, so it can present itself to patients via social media and websites, and patients can access it world wide. Likewise, costs can be very modest compared to conventional dietician visits because much of the work is group based and requires no fixed overhead for space.
But however innovative it may be, one needs to ask what it can accomplish in real world terms, and the first of these terms can only be this: Can one demonstrate reduction of urine stone risk?
Here, we report outcomes from the first group of patients who have complete initial and followup lab data.
The lovely ‘Ballet Class’ by Edgar Degas, painted between 1871 and 1874 is in the collection of the Musée d’Orsay, Paris, France.
Patients
We have complete information on 35 of 167 patients (21%) who participated in the course from December 2016 through November 2017. Of these, 26 were in online groups and 9 had individual phone counseling. One online group patient had such disparity in urine creatinine levels between baseline and followup we discarded the information and did not count her as part of the 35. The majority formed calcium oxalate stones. Of the 35, 13 were men. Mean age was 54.6 years.
Every patient had pre-treatment 24 hour urine studies and was told by their physician to alter diet. Systemic diseases were evaluated by their physicians. Two patients had bowel disease (crohn’s colitis and bowel resection), one was paraplegic. Two had formed uric acid stones. Otherwise they were idiopathic calcium stone formers. Because the kidney stone diet acts against risk factors from all of these forms and etiologies of stone disease, we pooled all data for this analysis.
Intervention
Seven Specific Interventions
The kidney stone diet has seven components: High fluid (2.5 l/d urine volume) and calcium intake (1,200 mg/d); reduced sodium (<1,500 mg/d) and refined sugar intakes (added sugar <25 gm/d and < 38 gm/d, women and men, respectively); moderate protein intake (0.8 – 1 gm/kg/d, both sexes); diet oxalate below 100 – 200 mg/day; increased intake of fruits and veggies (5 servings/d) with care about oxalate. We understand that 1,200 mg of diet calcium is the recommended value for everyone and should not be called ‘normal’, not ‘high’. But the average person in the US consumes below 500 mg/d of calcium, so 1,200 mg/d is essentially ‘high’ in that context.
Rationale
High calcium intake timed with larger meals will reduce urine oxalate and provide for bone. Low sodium intake will moderate the expected rise of urine calcium from the diet and benefit bone and blood pressure. Reduced refined sugar will prevent spikes of high urine calcium and low urine flow rate. It also acts against obesity, insulin resistance, and diabetes. Moderation of diet protein reduces urine calcium. It also moderates hyperfiltration and acid load – that both can foster progression of chronic kidney disease. Fruits and veggies provide potassium anion to raise urine citrate and pH. The potassium can lower blood pressure, and the alkali load counterbalance acid load from protein. Obviously, fluids reduce supersaturation directly. We chose our goal based on the stone risk factor analysis of Gary Curhan (increased stone risk begins below 2.25 l/d urine flow). Specification of reduced diet oxalate to below 100 – 200 mg/d is unique to calcium oxalate stone prevention and has no other proven health benefit.
Hypothesized Outcomes
The diet approximates that used by Borghi in his 5 year trial of diet against recurrent calcium oxalate stones. Compared to a 400 mg/d calcium, 200 mEq/d sodium diet he found that a 1,200 mg/d calcium, proposed 50 mEq/d sodium (actual achieved diet sodium was 125 mEq/d), 200 mg/d oxalate diet produced a fall in urine oxalate but similar urine calcium levels, and therefore a fall in CaOx supersaturation. Over five years, compared to the lower calcium / higher sodium diet, the higher calcium, lower sodium diet reduced new stone formation by about half.
His diet was 93 gm of protein daily, for men, which is liberal. He did not not specify amounts of fruits and veggies, nor refined sugar. He specified high fluids in both of his groups, so he did not expect nor find a difference in final urine volumes.
From this, we predicted we would find a marked fall in urine oxalate and sodium excretions, increased urine volume, and a fall in CaOx supersaturation. We might have expected a rise in urine pH and/or citrate. We did not predict any change in urine calcium because he found none, and because, as he did, we did two things at once: reduced diet sodium and increased diet calcium.
Significant Results
Of our four expectations, all materialized, but statistical significance was limited to only three of the four.
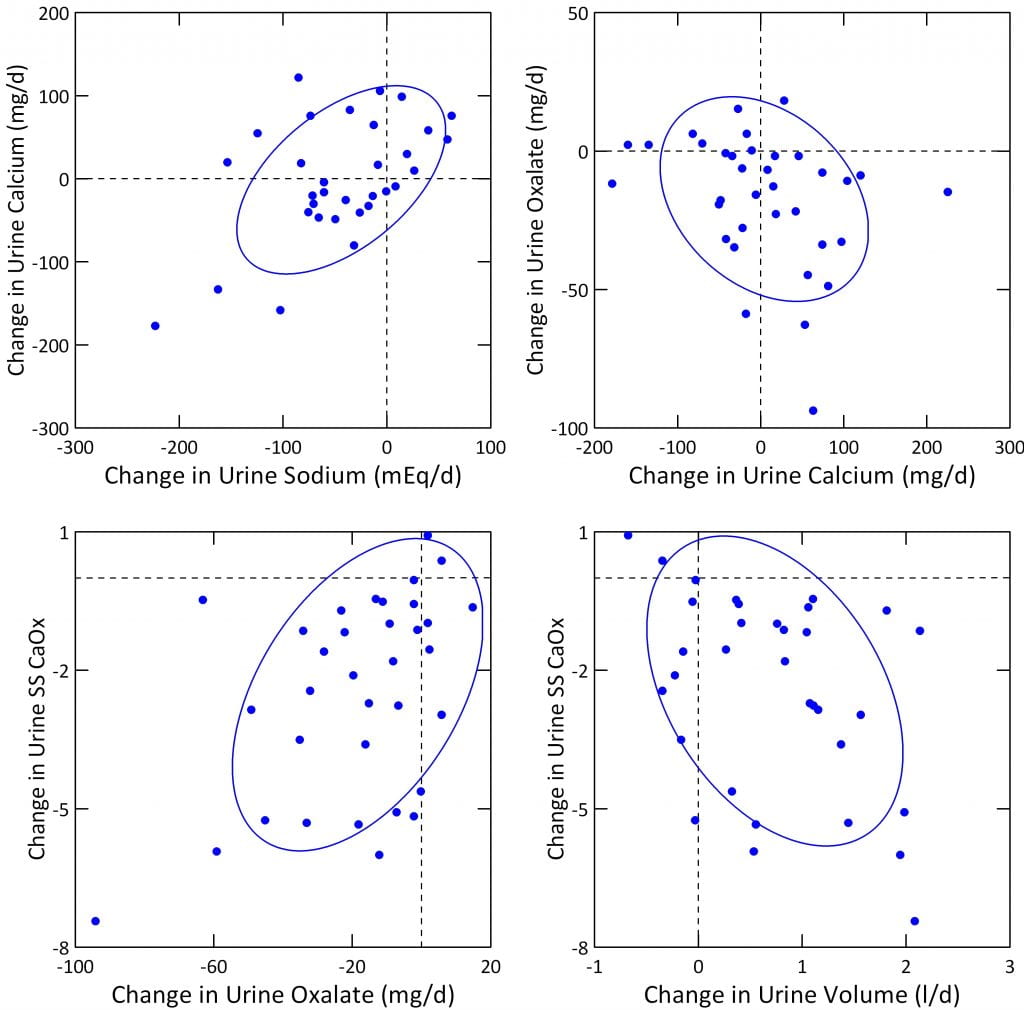
The four panels below show results for urine sodium, oxalate, volume and CaOx SS. Pre-treatment values are on the horizontal axis, and treatment values on the vertical axis. Points on the diagonal line of identity mean no change occurred. Points above that line mean urine excretion rose, and below the line means it fell. The big red triangles connect the mean pre treatment and treatment values. Each blue point is one patient.
The dashed vertical and horizontal lines represent the beginning of stone risk for oxalate and volume as derived by Curhan. For sodium they mark the tolerable upper limit of intake. For calcium oxalate supersaturation (SS CaOx) we lack definitive limits but have marked values of 4 that have always been our treatment goals.
Sodium
Nine patients raised their urine sodium (graph below, upper left panel); you can see these 9 blue points above the diagonal blue line. All the rest fell, except for one case where the blue circle is on the line. The mean value before treatment was 206 mEq/day, after it was 121 mEq/day. The mean (average) fall was 68 mEq/day (33%), but because of the obvious scatter it did not quite reach statistical significance (p=0.069). The p or probability value means we could have found this difference 6.9% of the time by chance alone.
In mg/d, the common units found in food labels (23 mg sodium per mEq), the mean fall was 1610 mg/day.
Note that the mean of the individual differences does not match the difference of the means, so if you subtract 121 from 206 you will get 85 mEq/day as a fall in sodium. The mean of the individual differences is a preferable index of change as it includes the variability of the difference from patient to patient.

Oxalate
Using the same kind of plot, urine oxalate obviously fell a great deal, and with considerable consistency (upper right hand panel). Only 6 blue points lie above the blue line of identity, and one on the line. The mean value fell from 45.1 to 29.3 mg/day. The mean change in urine oxalate was 17.4 mg decrease (38.4%), and the p value for the likelihood of this change being chance was below 0.001, or 0.1%. The treatment value of 29 mg/day is just above the threshold for stone risk from this molecule (25 mg/day).
Whereas the other three plots show a tilted ellipse, meaning the treatment values were related to the pre-treatment values, the ellipse for oxalate lies perfectly flat. This means that whatever the starting value before treatment, the diet more or less brought everyone down to about the same final value.
Volume
Urine volume rose in all but 10 patients (2 on the line), and notably these 10 had high baseline volumes above the risk level of 2.25 liter/day. The average value rose from 2.77 to 3.53 l/day. The mean change in volume was 0.827 l/day (31%), and the p value was below 0.001 or 0.1%. Before treatment 12 patients had low enough volume to confer stone risk (below 2.25, points to the left of the vertical dashed line). During treatment only 3 patients remained below the 2.25 level (below the horizontal dashed line).
CaOx Supersaturation
Supersaturation fell in all but 3 patients, from a mean of 5.2 to 2.8 (56%). The p value for the change, -2.425, was below 0.001 or 0.1%. We lack stringent links between stone risk and supersaturations, but 18 patients were above 4, a value we have usually considered the upper threshold of risk, and during treatment only 6 remained at or above that level.
Mechanisms
Expected Results
We believe that the large fall in urine oxalate reflects increase of diet calcium, not merely decrease of diet oxalate. If this were true we should expect that the fall in oxalate was significantly inverse to the rise in urine calcium accepting the fact that urine calcium is complex and certainly being affected by changes in diet sodium and calcium intake. For calcium oxalate SS, we suspect the rise in volume and lower urine oxalate were major factors.
Even though we altered calcium and sodium intakes, and these alterations work in opposite directions on urine calcium, we expect to find a correlation between urine calcium and urine sodium that reflects their usual renal handling.
Calcium and Sodium
Our graph (upper left panel) shows the usual positive correlation between urine calcium and sodium, in this case expressed as changes from baseline in each. But in a general linear model (GLM) correcting for urine creatinine, the effect of changes in sodium were only borderline significant (p = 0.049). With more patients we may find yet greater significance.
Since urine calcium and sodium are tightly linked in most experiments we assume our findings reflect that we increased calcium intake and reduced sodium intake both at the same time.
Oxalate and Calcium
As urine calcium rose, urine oxalate fell (upper right panel), the expected direction if increased diet calcium was a factor lowering urine oxalate. In a GLM including change in urine sodium, urine oxalate was indeed inversely related to urine calcium, albeit not quite significantly (p=0.056).
Because we did two opposing things, raised diet calcium and lowered diet sodium, urine calcium is a poor gauge of diet calcium here. Even so, as urine calcium went up because of higher diet calcium, urine oxalate went down, meaning at least part of the fall in urine oxalate was from increased diet calcium. This accords with experiments proving that increased diet calcium lowers urine oxalate.
CaOx SS
In a GLM with urine calcium, oxalate, volume, and sodium as independent variables, changes in oxalate and volume were highly and significantly correlated with fall in SS CaOx. Urine CaOx SS fell with urine oxalate (left lower panel above) and inversely with urine volume (right lower panel above), p<0.01 for both. For CaOx SS, the fall in urine oxalate was perhaps the more important effect: t values for change in urine oxalate and volume were 3.4 and – 3.1, respectively.
Changes in Sodium
Although reduction of diet sodium was a prime goal, we did not achieve a large enough fall. We desired a diet sodium below 100 mEq/d (2300 mg) and ideally below 65 mEq/d (1500 mg) whereas we got 123 mEq/d as an average. Although our result is laudable, a larger fall in diet sodium would have lowered urine calcium more, in benefit to the patients.
Comparison to the Borghi Trial
The Trial
Howsoever good the rationale for the kidney stone diet, the only formal trial is that of Borghi, and that trial concerned only part of what has been identified to date as ideal. He began with a patient group of all men with idiopathic hypercalciuria who formed calcium oxalate stones. He randomly assigned half to a low calcium diet – 400 mg/d, high fluids (red symbols on figure). The other group was counseled to eat 1,200 mg/d of calcium, 50 mEq/d sodium, below 200 mg/day of oxalate, and 93 gm/kg/d of protein (blue symbols) but with the proviso that about half the protein derived from plant sources.
I have detailed the stone outcome elsewhere, but never before the urine stone risk changes. The figure below plots the data in Table 3 from the publication. For visual clarity, the baseline – before any diet change – is shown at time 0. The sample of urine taken at 1 week of the diets is shown as 0.25 months. The remaining five urine studies are shown at equal intervals of 12 months each. Points are means with standard errors, blue are the high calcium, red the low calcium diet groups.
Changes in Calcium
Borghi
Both the low calcium and high calcium diet groups had very high urine calcium levels on their self choice diets – the time 0 points (upper left panel on the figure below), 11 mmol/d of calcium is 440 mg/day. They were chosen for being hypercalciuric men.
Lowering diet calcium to 400 mg/d lowered urine calcium at one week – red symbols, 0.25 months point. But – surprisingly – increasing diet calcium to 1,200 mg and lowering diet sodium to 50 mEq/d (see the sodium graph, left lower corner of the figure, blue point fell to 50) lowered urine calcium below that of the low calcium diet.
Pause a moment and think about this. The blue line people ate 1,200 mg/d of calcium, the reds ate 400 mg/d of calcium. We know this as they were tightly supervised. Yet, and even so, when the diet sodium was really low, 1150 mg, 50 mEq/day, the blue people had vastly lower urine calcium.
Where did the calcium go? We know from the Teucher study where it went: Into bone.
Just as Adam and Eve could not stay in Paradise, these patients could not maintain so perfect a diet sodium.
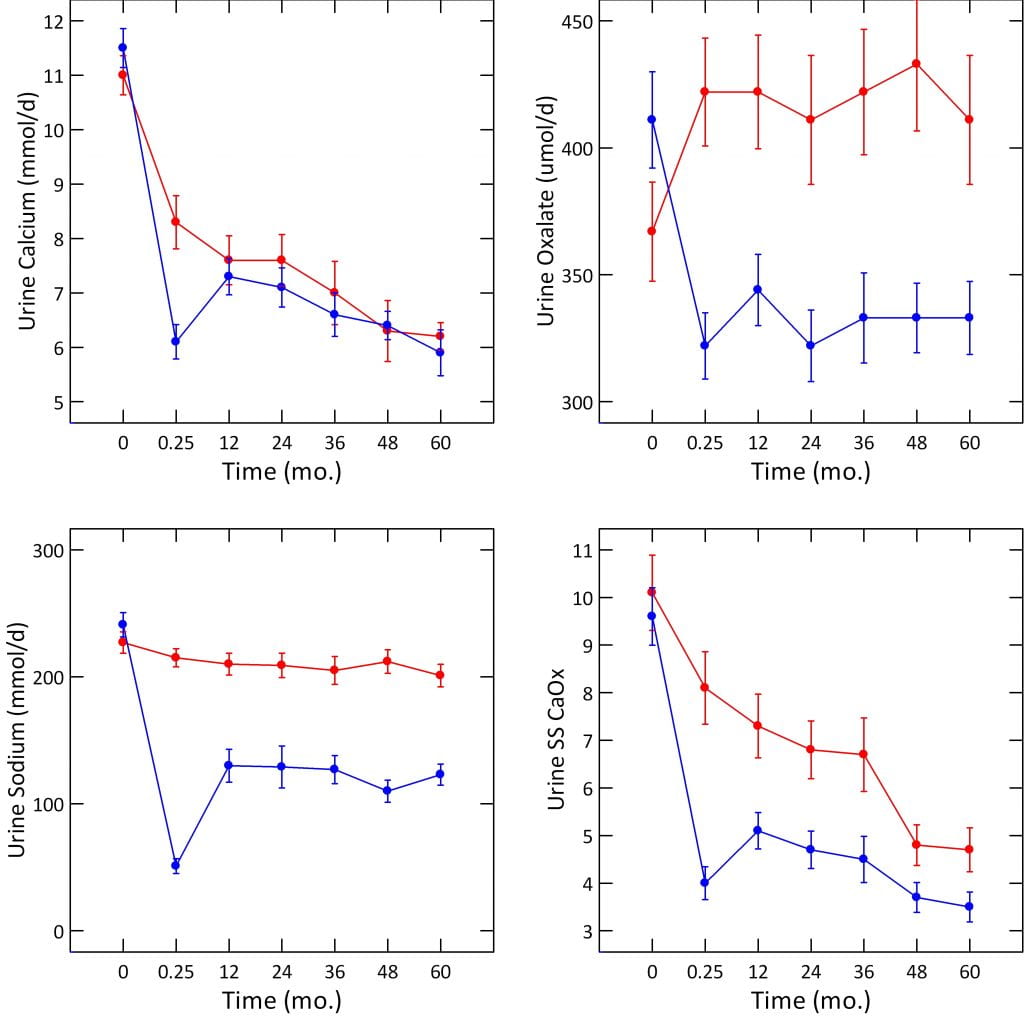
By one year, sodium intake had risen to about 125 mEq/day, and urine calcium to about 7.5 mmol/d, or about 300 mg/d. This does not differ from the low calcium diet group but remember we are comparing 1200 mg/d to 400 mg/d of diet calcium. Only the low sodium diet keeps the 1,200 mg/d calcium diet from raising urine calcium, a lot.
Perhaps more than any other experiment, this one unequivocally demonstrates how extreme the influence of diet sodium on urine calcium.
Our Results
Unlike Borghi, our patients were not very hypercalciuric to begin with (218 mg/d). We dropped sodium from 206 to 121 mEq/d, raised diet calcium to 1,200 mg/d, and found no significant change in urine calcium (218 to 216 mg/d). Had we not lowered diet sodium, we should have expected a rise in urine calcium. Because our patients were not hypercalciuric on average, we are not surprised by our results. When plotted against diet sodium, people without hypercalciuria have a much lower slope of urine calcium than those with hypercalciuria. So, allowing for the differences in patients, we consider our findings more or less in accord with his.
Changes in Urine Oxalate
Borghi
On their free choice diets, his two groups hardly differed: 367 and 411 umol/d (red and blue points, upper right panel of the figure). As the graph shows, low calcium diet raised oxalate to 422 umol/d, whereas high calcium diet lowered it to 322 umol/d. Thereafter the two groups differed by 100 umol/day for the five years of the trial. Given the MW for oxalate ion of 88 mg/mmol, and that we observed a change from 45.1 to 29.3 mg/day (512 to 332 umol/d), our outcome was almost exactly identical to that in the Borghi trial. Like Borghi we sought a reduced oxalate intake (100 mg/day for us, 200 mg/day for Borghi). How remarkable the effects of increased diet calcium that two so completely different experiments should yield virtually the same result!
Changes in Sodium
Borghi achieved a fall from 241 to 50 mEq/d at one week, but thereafter intake rose to about 110 – 130 mEq/d. So, our achieved sodium of 123 mEq/d compares well with his. Unlike Borghi, we had none of the apparatus of a trial, with constant nursing supervision.
Changes in CaOx Supersaturation
Both of his groups had free choice diet values of 9.6 – 10 that fell to the range of 3.5 – 5. Our patients began much lower, 5.2, and fell to 2.8. So, our final diet achievements with respect to SS CaOx were about the same. We do not know if we would have achieved so low a final value had we begun at the high values of his patients.
Urine Volume
Borghi’s patients began at 1.7 – 1.8 l/d, and he aimed for, and achieved, 2.2 l/d of urine volume in both of his groups. Our patients began at 2.77 l/d and rose to 3.53 l/d. Our higher goal reflects the finding that risk from urine volume disappears at above 2.2 l/d, so we strive for a greater margin above that point. Of interest, we achieved our volume goal with only a web based and intermittent coaching model, vs. a far more elaborate nursing supervision funded by his trial.
Altogether
At so early a stage we would be presumptuous to place excessive emphasis on our results vs. those of his remarkable and long term trial. But one can say that we achieved about similar results for oxalate, sodium, urine volume, and urine CaOx SS. In a sense we ‘replicated’ his pioneering work in our small observational study, but that we did so adds perhaps some weight to the powerful effects of high diet calcium on urine oxalate, of diet sodium on urine calcium, and of the two together with high fluid intake on CaOx SS which is, after all, the primary driving force for crystallization.
Calcium Phosphate Supersaturation
Our diet approach did not aim squarely at CaP SS because we raise diet calcium to lower urine oxalate and, of course, benefit bones. Such an increase of diet calcium prevents a marked fall in urine calcium, a main factor affecting SS CaP. Borghi, on whose trial the kidney stone diet was modeled, did not specifically focus on CaP SS, perhaps because the unique role of brushite and apatite crystals in stone growth on plaque or plugs had not been fully understood.
 What We Found
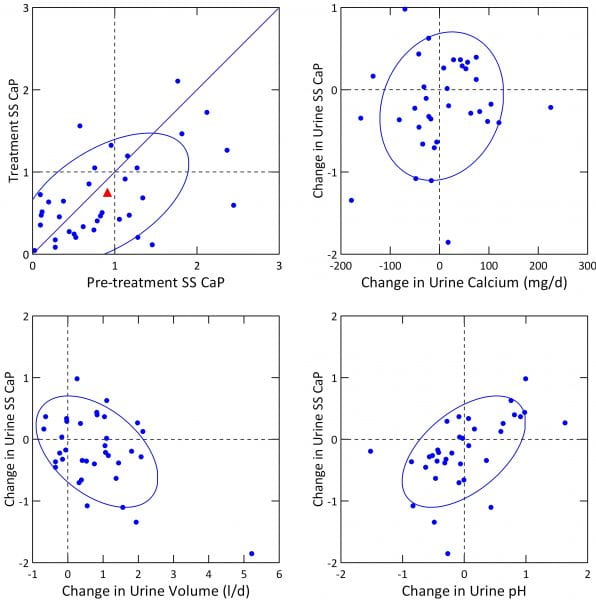
A simple plot of treatment vs. baseline SS CaP (upper left panel) shows that the fall was modest indeed. The mean change was marginally significant (-0.2, p=0.048). Because many people were below 1 before treatment, reflecting their high urine volumes and very modest urine calcium excretions, we had little we could have done to lower it further.
Within the range of change of urine calcium we could not find an independent effect of calcium change on SS CaP change (upper right panel), even though, when considered with pH and volume change in our GLM, calcium was a significant covariate.
Effects of change in volume and pH were marked (lower panels). This accords with their significant linkages to CaP SS in our general linear models (below).
In a GLM for change in urine SS CaP with urine sodium, calcium, volume, and pH as covariates, all four, volume, pH, calcium, and sodium had independent effects (p values were <0.001 for change in pH and volume, 0.003 for calcium and 0.009 for change in urine sodium). CaP SS fell with rising sodium and volume, and rose with pH and calcium.
What it Means
The main effect on urine CaP SS is from increased volume. But if we achieved a larger fall in urine calcium – meaning a larger fall in diet sodium – CaP SS would have predictably fallen.
Urine pH has a well known effect to raise CaP SS. We found that effect here. But the clinical value of such knowledge is limited. If pH is being increased by, for example, fruit or veggie smoothies, cessation could reduce pH and CaP SS. If no obvious diet cause can be found, we have no treatment to safely lower urine pH.
Diet Protein and Potassium
Our diet proposed increased fruit and veggie servings to five daily so as to achieve about 100 mEq of potassium intake. This would be mainly as potassium organic anion as opposed to chloride. Urine potassium increased from 64 to 76 mEq/d (mean change = 10.0, p=0.007). We did not observe significant changes in urine ammonium ion ( 33 vs. 33). Urine sulfate (37 vs. 34), and protein catabolic rate – an estimate of protein intake – (1.98 vs. 1.1). Both fell – (pre vs. treatment values in parentheses), but the changes were not significant.
Taken together we infer we did not increase food potassium ion sufficiently to affect acid base balance. This accords with our failure to find a significant change in urine citrate (638 vs. 667, baseline vs. treatment).
Our Final Take
Promising Initial Results
We have more or less reproduced the results Borghi published from his important prospective trial.
Raising diet calcium, and fluids, and lowering diet sodium together lowered urine oxalate and SS CaOx remarkably. Our advice to lower diet oxalate no doubt contributed, but the increased diet calcium was a factor given the inverse relationship between increase of urine calcium and fall in urine oxalate. The result is a fall in urine oxalate excretion and in CaOx SS, as he found. A point by point comparison between the trial and our observations supports that our measures had effects equivalent to those of the trial.
The higher calcium intake is valuable for bone as is the lower diet sodium. So the four effects: more diet calcium and water, less diet sodium and oxalate, help reduce stone risk as well as act in favor of bone health. Lower sodium intake, and the small increase we found in urine and therefore diet potassium, would also benefit blood pressure. In other words the diet achieves not only lowering of stone risk but acts against the other well known risks stone formers have – for high blood pressure, bone disease, and kidney disease.
We emphasize that these are data from a self selected subset of patients – those who did both pre and post treatment 24 hour urine studies. With time we hope for a more inclusive set of results. As well, we are making prospective observations, not conducting a trial.
But also as well, we have achieved rather notable outcomes given a model with minimal cost to patients that has no dependency on grant support or other subsidies. In a sense that makes these early data potentially very interesting.
Obstacles
We could not lower urine calcium using reduction of diet sodium given we raised calcium intake markedly. Borghi worked exclusively with hypercalciuric men, and did lower their urine calcium excretion despite high calcium diet. Perhaps we would have found as he did if our patients had been more hypercalciuric, or if we had achieved a greater reduction of diet sodium. That a greater fall in diet sodium would have done more was proven by the week one results of the Borghi trial. Despite the high calcium intake, urine calcium fell most remarkably when urine sodium reached as low as 50 mEq/d. But the required urine sodium of 50 mEq/d was not achievable long term.
Because we could not change urine calcium much, nor urine pH, we could not much change SS CaP.
Perhaps the diet can do a lot but thiazide might be needed as an addition for those with CaP stones, or persistent CaOx stones. Even so, the diet is a proper base because of the bone and blood pressure benefits, and because the dose of thiazide can be lower and potassium wasting less marked.
Where Would I Find Jill Harris?
We thought you would never ask. She is here: Kidney stone diet.
Disclaimer
Because of the importance of even these initial results, I wish to post a public disclaimer concerning any possible conflicts of interest.
Although I obtain no present or future financial benefits from her work, Jill Harris is my close working colleague and protege. She earns money from her coursework.
Acknowledgement
We want to thank Dr John Asplin who was kind enough to read this article for us and offer valuable suggestions. Since it reports original data his reading was of great importance to assure against errors we might have made.
Hi Dr. Coe,
Very informative study. However, personally I had a somewhat adverse result as a result of increasing diet calcium. Let me give you my numbers. After trying to control my diet sodium, my 24 hour urine results were Na 88 mmol, Ca 230, Oxalate 50. I should say during this time my diet Ca was minimial, probably 100mg from misc food. Then I tried lowering diet Na further and increasing diet calcium. I probably took about 600-700 mg of diet Ca (with meals) while not really changing my daily food pattern. Sure enough my Oxalate went down from 50 to 40, my Na was 76, but my urine Ca shot up to from 230 to 450.
I am guessing the reason the patients in your study didn’t have that high of urine Ca, even though they had much higher average urine Na than me, is because they were not very hypercalciuric to begin with. My urine Ca before any salt control was in the low 300’s with Na around 200 mmol.
The lesson I took away from my experience is that things will get worse for me by increasing diet calcium, if I cannot get my Na below 65. My plan is to stick with low sodium, low calcium diet, since I am not very confident of being able to stay below 65 Na on a consistent basis. Do you agree? Was the decrease in Oxalate worth the increase in urine Ca? What would you advise in my case?
Thanks
Josh
Hi Josh, You are an astute and thoughtful observer. Perhaps you do indeed have marked idiopathic hypercalciuria. The extra diet calcium has lowered your oxalate – though not as much as I would have hoped, and your urine calcium went up – I am sure you added the calcium either as food or supplements with your larger meals. Ideally I would try to lower diet sodium more, but in your case the best move is to keep diet calcium high and add a thiazide type drug like chlorthalidone – 12.5 mg on top of the low sodium. That should lower the urine calcium and let you increase diet calcium more to lower the oxalate. The Borghi trial was all men with above 300 mg/d urine calcium. Low calcium diet in IH is not a good idea – oxalate will be problematic and you have a skeleton. Another thing – be sure your PCR is 1 or less gm/d/kg of protein – more will raise urine calcium a lot. Likewise limit refined sugar – it can push calcium up. Finally, I am not your physician, so your actual physicians need to agree with all this and help. Please feel free to share my thoughts as you wish. But do not do things without your physicians – they are very valuable to you. Regards, Fred Coe
Hi Dr Coe,
My urologist agreed with your assessment and put me on indapamide 1.25 mg. I just did a 24 hr urine, but the results didn’t really change. My numbers before and after indapamide , listed in that order, Urine Na 76 to 77 mmol, urine oxalate 40 to 37mg, Urine Ca 450 to 455, urine pH 6 to 6.3.
What happened? I thought Urine Ca was supposed to go down as well as pH? Maybe the mistake I did was, I stayed on a low salt, low calcium diet (100-200mg) while on indapamide (since I had seen in my previous test that most of my diet Ca went to urine), but only increased diet Ca to about 700mg on the day of the test and the night before. The more I look at the Borghi trial there seems to be a time dependence on Urine Ca decrease. Even the people on 400mg diet Ca saw the urine Ca decrease over time. Do you think they were on a even lower Ca diet when they first started? If that is the missing link in my test results, how long should I stay on high diet Ca before doing another urine test?
Even then I am still a little worried that the Ur Ca didn’t go down at all with indapamide (in fact it went up), I would have expected it to go down at least 50 points.
Do you have any other explanations? What should I do? I am a diabetic, so increasing indapamide dosage might not be an option.
Let me know if you want other test numbers.
Thanks
Josh
Hi Josh, The low sodium and indapamide failed to lower your urine calcium, and you are diabetic. The latter can matter. Some drugs for diabetes raise urine calcium. The timing of the diet calcium should not have mattered, but it is better to be on a stable high calcium intake when tested. I would stay on the low sodium high calcium diet with indapamide for a few more weeks and recheck; if the urine calcium remains high, then one needs to understand why. Urine pH does fall a bit with thiazide like drugs but that is more a research finding than one detectable with a changing diet acid intake. Is your diabetes late onset or early? Are you insulin dependent? What drugs are in use? Is your blood calcium normal? – I cannot personally advise in any detail but your physicians should consider all this. Regards, Fred Coe
Thanks for the response Dr. Coe. My diabetes is late onset type 2 and yes I do take insulin (Lantus to be exact). Other drugs are Metformin for diabetes, ramipril to protect kidneys and fenofibrate for triglycerides. My serum calcium done just after 24 hr urine collection was 10.2mg/dL. A PTH test done late last year was 12pg/mL. Let me know if any of this would cause high urine Ca.
Can you also explain why urine Ca decreased with time for both groups in the Borghi trial, even though presumably their diet Ca was constant?
Thanks
Josh
Hi Josh, If your serum calcium was measured fasting, the value is suspicious and bears repeating – fasting must be complete since midnight before blood draw. As for Borghi, I suspect a waning of interest in diet control. There is no known adaptation to lower urine calcium. Some have proposed a decrease in active vitamin D production, but sans proof. Diabetes itself can raise urine calcium and produce bone mineral loss, and your low serum PTH is compatible with that. Likewise it is compatible with other causes of high urine calcium unresponsive to diet sodium and indapamide. Your physician might want to evaluate for those with such as serum 1,25D levels. Regards, Fred Coe
Hi Dr. Coe, Thanks again for response below. Starting a new thread since it is going off the right side 🙂 The blood calcium was measured fasting, except that I took my meds in the morning, including 2400 IU of vit. D and a multivitamin. Why is high blood calcium suspicious? Is it because it might indicate I have hyperparathyroidism, or does my low serum PTH exclude that possibility?
If diabetes (which is well controlled) is the sole reason for my high urine calcium, is there no solution for me, other than low sodium, low calcium diet? What would one learn from serum 1,25D levels?
With regard to Borghi, if as you say the urine Ca went down with time, due to less diet Ca over time, wouldn’t that have resulted in a corresponding increase in urine oxalate over time? Seems like the oxalate remained somewhat stable over time (at least after the first week). Still a little puzzling to me.
Thanks – Josh
Hi Josh, You ask fine questions but given I have a limited knowledge of your real situation we need to be careful that I do not interfere with proper treatment. In general low sodium high calcium diet (not low calcium!) + thiazide if needed are a good approach; diabetes is something more complex especially if it came on in mid years not older. As for the details of a trial, we would have to review them almost in person to speak sensibly because the trends you notice did not mostly achieve statistical significance. Serum 1,25D is not needed, but I would measure it because your urine calcium seemed quite high. The low PTH could reflect perhaps a very high 1,25D. If so, perhaps there might be a reason for it. Regards, Fred Coe